Download the HPLC Calculator App: The Ultimate HPLC Analysis Tool
Your expert companion for HPLC method development, liquid chromatography troubleshooting, and calculating parameters for both RP-HPLC and UPLC systems.
Get instant access to advanced HPLC calculations and community support
Questions

The Problem: The Pressure vs. Efficiency Trade-off
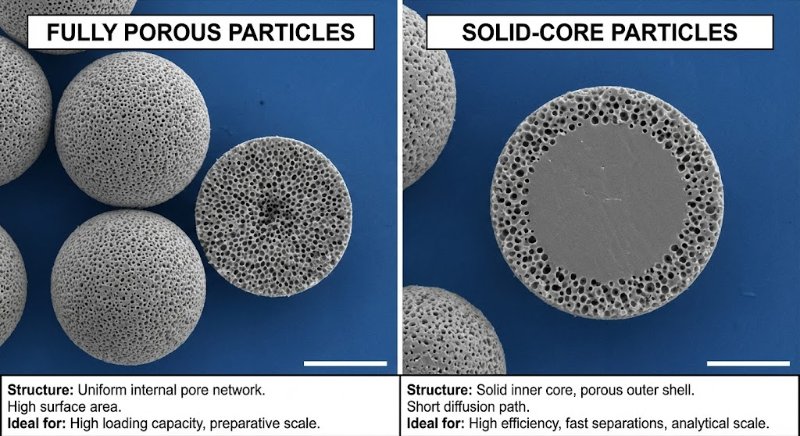
Totally Porous Particles (The Old Standard): These are like "sponges" or "Nerf balls"—pores go all the way through. To get better separation (efficiency), you need smaller particles.
The Trap: As you shrink the particle size (e.g., from 3.5 µm to 1.8 µm) to sharpen peaks, the backpressure skyrockets (often quadruples). Standard HPLC instruments (max ~6000 PSI) cannot handle the pressure required by these sub-2 micron particles.
The Solution: Superficially Porous Particles (SPP)
Also known as Core-Shell or Porous-Shell particles, these offer a "best of both worlds" solution:
The Structure: They have a solid, non-porous core (like a glass marble) coated with a thin porous shell.
Example: A 1.7 µm solid core + a 0.5 µm porous shell = 2.7 µm total particle size.
Why It Works:
Lower Pressure: The pump "sees" a larger 2.7 µm particle, keeping backpressure low enough for standard HPLC instruments.
Higher Efficiency: The sample molecules only have to diffuse through the thin outer shell (short diffusion path). This mimics the physics of a much smaller (~1 µm) particle.
Key Takeaway
Superficially porous columns allow you to achieve UPLC-level efficiency (sharp peaks) using standard HPLC hardware (lower pressure).
No answers yet.
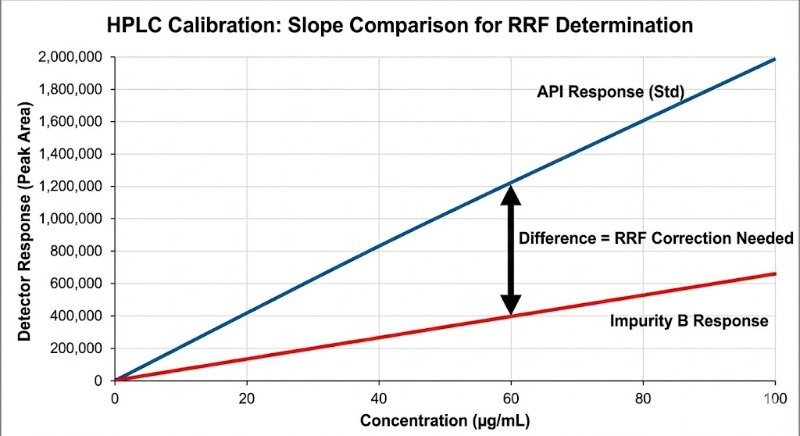
In HPLC analysis, the biggest lie a chromatogram can tell you is that "bigger peak = more amount."
We all know that different molecules interact with detectors differently. Yet, assuming a Relative Response Factor (RRF) of 1.0 for impurities is still a common shortcut that can lead to dangerous under- or over-estimation of toxic impurities.
Why RRF Determination is Non-Negotiable:
Chromophore Differences: Just because it’s an isomer doesn’t mean it absorbs UV light the same way.
Wavelength Sensitivity: An RRF valid at 254 nm might be completely wrong at 210 nm.
Regulatory Impact: ICH guidelines (Q3A/Q3B) often require correction factors if the response differs by more than 10-20% (0.8–1.2).
The "Slope Method" Gold Standard: To get a true RRF, avoid the single-point check. You need to compare the slopes of the linearity curves (Impurity vs. API) to rule out matrix effects and intercept bias.
RRF = Slope (Impurity) / Slope (API)
If you aren't correcting for response factors, are you really quantifying? Or are you just guessing?
How does your lab handle RRFs for unknown impurities? Do you default to 1.0 or run full slope-method determinations?
No answers yet.
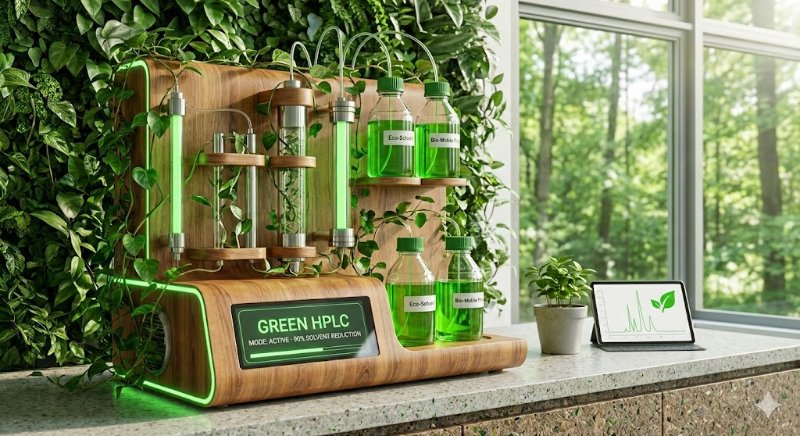
Sustainability in the lab is no longer just a buzzword—in 2025, it’s a necessity. With rising solvent costs and stricter waste regulations, Green Chromatography is becoming the new gold standard in pharmaceutical R&D and QC.
3 Trends defining the Green Shift:
Solvent Swaps: We are seeing successful validations replacing traditional solvents like Acetonitrile and Methanol with greener, bio-renewable alternatives like Ethanol and Dimethyl Carbonate (DMC).
Miniaturization: The shift to micro-LC and nano-LC is cutting solvent consumption by up to 90% without sacrificing resolution.
Core-Shell Efficiency: Using sub-2 µm core-shell particles to speed up runs and drastically reduce mobile phase usage.
It’s not just about saving the planet; it’s about saving the budget.
Call to Action: What’s the biggest challenge you face in making your methods greener? Let's discuss in the comments. ?
#GreenChemistry #HPLC #Sustainability #Laboratory #PharmaRD #GreenHPLC #AnalyticalChemistry #2025Trends
No answers yet.

No answers yet.

Choosing the right buffers and solvents is critical in LC-MS because the entire mobile phase directly enters the mass spectrometer. Compatibility with the ionization source (like ESI or APCI) is essential for high-quality data.
1. Why Volatile Buffers are Essential
Non-volatile salts, such as phosphate buffers, are unsuitable for LC-MS. As the mobile phase evaporates, these salts leave a residue that can:
Contaminate and clog the ion source.
Cause signal suppression.
Increase background noise.
Necessitate frequent and costly maintenance.
Volatile buffers are the solution. They provide stable pH control while being easily removed in the gas phase.
Benefits of Volatile Buffers:
High Sensitivity: They evaporate cleanly, allowing analytes to ionize efficiently without interference.
Low Background: Complete evaporation minimizes background ions, leading to a cleaner spectrum and better signal-to-noise.
System Stability: They prevent the residue buildup that plagues systems using non-volatile salts.
Common Volatile Buffers:
Ammonium Acetate (pH range ~4-6)
Ammonium Formate (pH range ~3-6)
Formic Acid / Acetic Acid (for acidic conditions)
Ammonium Hydroxide (for basic conditions)
2. Why Non-Polar Solvents Should Be Avoided
The choice of organic modifier is equally important. Non-polar solvents (like hexane or toluene) are not recommended for typical reversed-phase LC-MS for several reasons:
Poor Miscibility: Most LC-MS mobile phases are aqueous. Non-polar solvents are immiscible with water, which can cause phase separation.
Low Volatility & Unstable Spray: They do not evaporate efficiently in the MS source, leading to an unstable spray, a noisy baseline, and system contamination.
Ion Suppression: Their low dielectric constant is not conducive to good ion formation in ESI, resulting in poor signal intensity.
Safety Concerns: They often have higher toxicity and flammability.
3. Preferred Solvents for LC-MS
The most commonly used solvents are polar and volatile, such as Methanol and Acetonitrile.
These are ideal because they are:
Fully miscible with water.
Highly volatile, ensuring easy removal in the ion source.
Able to produce stable electrospray droplets, which promotes efficient ionization.
#PharmaceuticalAnalysis #MethodDevelopment #Principle #LCMS #UHPLC #HPLC #GC #GCMS #Volatile_Buffers #Non_polar_solvents #USP #IP #WHO #CDCSO #ICH #MHRA #AnalyticalChemistry #Solactivity #DrugDevelopment #Chemist #validation #science #pharma #GLP #SCIENCE #analytical #scientist #knowledge #sharing
No answers yet.

One of the most important choices in chromatography method development is deciding between Normal-Phase (NP) and Reversed-Phase (RP) HPLC. The following comparison outlines the main differences:
Normal-Phase HPLC
The stationary phase is more polar than the mobile phase.
Common column types include Silica, Amino (NH2), Diol, and Cyano (CN).
The mobile phase usually consists of non-polar solvents such as hexane or ethyl acetate.
Polar compounds are retained for a longer time.
Reversed-Phase HPLC
The stationary phase is less polar than the mobile phase.
Typical columns include ODS (C18), C8, C4, Phenyl, and Cyano (CN).
The mobile phase often contains polar solvents such as water or acetonitrile.
Non-polar compounds are retained for a longer time.
The retention order of analytes is essentially reversed when switching between NP and RP systems—this principle lies at the core of chromatographic separation.
Choosing the appropriate phase depends on factors such as analyte polarity, sample solubility, and the desired separation outcome.
#HPLC #Chromatography #AnalyticalChemistry #Pharmaceuticals #PharmaIndustry #DrugDevelopment #SeparationScience #ResearchAndDevelopment #LabWork #QualityControl #QC #MethodDevelopment #AnalyticalMethods #Biopharma #ChemicalAnalysis #PharmaResearch #ChromatographicSeparation
No answers yet.

In analytical science, precision is non-negotiable. Yet, one silent contaminant can distort results and jeopardize data integrity — carryover.
What is Carryover?
Carryover is the unintentional transfer of analyte from one sample injection to the next. Even trace residues can cause:
False positives
Inflated concentrations
Poor reproducibility
Regulatory non-compliance
Where Does It Come From?
Autosampler needle – inadequate washing
Syringe/injection port – especially in GC
Tubing and valves – adsorptive surfaces
Column or detector flow cell – strong retention
MS ion source – memory effects in LC-MS/MS
How to Detect It
Inject blanks after high-concentration samples
Watch for baseline drift or ghost peaks
Apply bracketing standards during validation
How to Prevent It
Use strong wash solvents with multiple rinses
Run a blank between critical samples
Select low-adsorption components (e.g., PTFE tubing)
Optimize autosampler wash/dwell times
Use column backflush or switching valves in GC
Apply divert valves or clean the source in LC-MS
Regulatory Perspective
Carryover evaluation is a required step in method validation as per ICH Q2(R1) and FDA/EMA guidelines.
Key Takeaway
Carryover may be subtle, but its consequences are serious. Prevent it with proper cleaning, smart method design, and strict validation practices.
#HPLC #GC #LCMS #AnalyticalChemistry #Carryover #MethodValidation #QAQC #Pharma #Biotech #Chromatography #RegulatoryCompliance #HPLCtraining #SkillDevelopment
No answers yet.
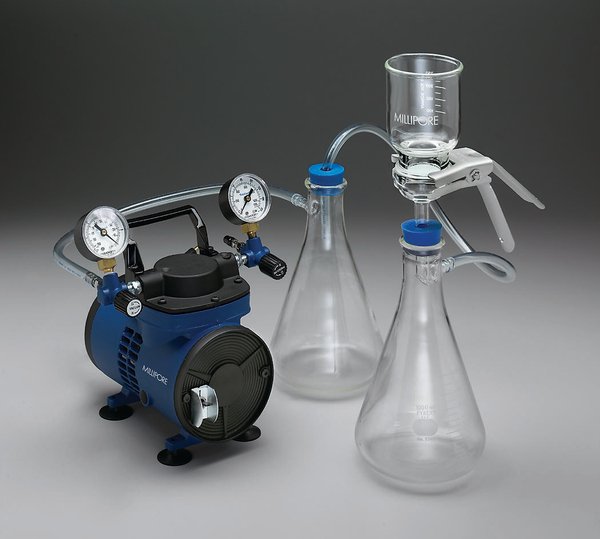
In chromatography, purity begins before the first injection.
One of the most overlooked yet critical steps is the filtration of buffer solutions used in the mobile phase.
Why is it important?
Removes particulate matter: Prevents column blockage, protects pump seals, and extends instrument life.
Enhances baseline stability: Eliminates micro-particles that can cause noise or ghost peaks.
Improves reproducibility: Ensures consistent flow rates and separation efficiency.
Ideal Filter Papers for Buffer Filtration
When filtering aqueous buffer solutions, it’s crucial to use the right membrane to avoid leaching or chemical incompatibility. Common choices:
Nylon (0.45 µm or 0.2 µm) – Excellent for most aqueous buffers; low extractables.
PTFE (0.45 µm or 0.2 µm) – Best for organic solvent compatibility; hydrophobic but can be pre-wetted for aqueous use.
Cellulose Nitrate / Cellulose Acetate (0.45 µm) – Low protein binding, suitable for biological samples.
Glass Fiber Pre-filters – Ideal for high-particulate buffers before membrane filtration.
Best Practice Tip: Always degas after filtration to prevent bubble formation inside the filter and ensure a smooth mobile phase flow.
#Chromatography #HPLC #AnalyticalChemistry #QualityControl #LabBestPractices #PharmaIndustry #ResearchAndDevelopment #BufferSolution #MobilePhase #Filtration hashtag#MethodDevelopment #LaboratoryTips #PharmaManufacturing #AnalyticalScience
No answers yet.
FTIR (Fourier Transform Infrared Spectroscopy) is a fundamental technique in analytical chemistry, materials science, and nanotechnology, providing a rapid, non-destructive way to:
Identify functional groups
Confirm chemical bonds
Validate structural changes in synthesized or extracted compounds
But how do we interpret FTIR spectra meaningfully?
1. Understanding the Axes
X-axis (Wavenumber in cm⁻¹):
Runs right to left, from 4000 to 400 cm⁻¹.
Higher values = high-energy vibrations (O–H, N–H)
Lower values = complex vibrations (fingerprint region)
Y-axis (% Transmittance or Absorbance):
Indicates how much IR radiation is absorbed.
Stronger peaks = more absorption = stronger molecular vibration.
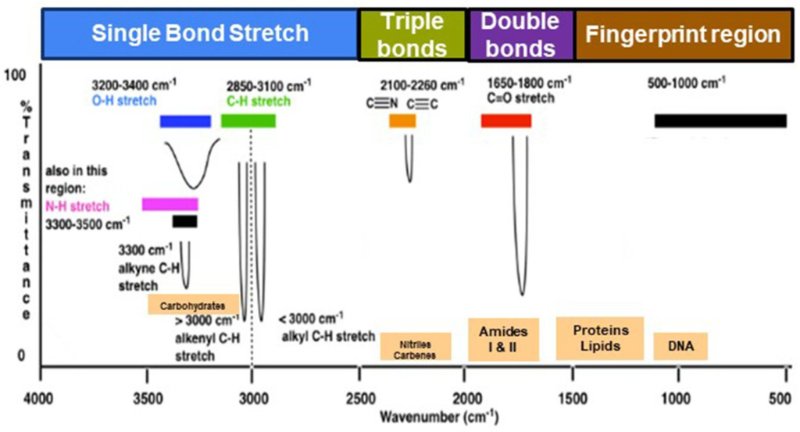
2. Divide the Spectrum into Regions
Region A: 4000–2500 cm⁻¹ (High-Energy Bonds)
• O–H (alcohols, phenols): ~3200–3600 cm⁻¹ → broad, strong
• N–H (amines): ~3300–3500 cm⁻¹ → sharp
• C–H (alkanes): ~2850–2960 cm⁻¹ → multiple sharp peaks
Region B: 2500–2000 cm⁻¹ (Triple Bonds)
• C≡C (alkynes): ~2100–2260 cm⁻¹ → weak
• C≡N (nitriles): ~2200–2260 cm⁻¹ → moderate
Region C: 2000–1500 cm⁻¹ (Double Bonds)
• C=O (carbonyl): ~1700–1750 cm⁻¹ → very strong
• C=C (aromatics): ~1600–1680 cm⁻¹ → moderate
• N–H bending: ~1550 cm⁻¹
Region D: 1500–600 cm⁻¹ — The Fingerprint Region
This region is unique for every compound and essential for confirmation.
Includes:
• C–O (alcohols, esters, ethers)
• S=O (sulfated polysaccharides): ~1220–1260 cm⁻¹
• C–N and C–Cl stretches
3. Pro Tips for Interpreting FTIR
Start with key functional groups: O–H, C=O, S=O
Analyze baseline and correct for water or CO₂ noise
Compare your results with reference spectra
For plant extracts or polysaccharides like fucoidan, focus on:
Broad O–H peaks
Aliphatic C–H groups
Sulfate (S=O) stretches
C–O–C glycosidic linkages
:)
No answers yet.

Gas Chromatography (GC) is a powerful analytical technique widely used to separate and analyze volatile organic compounds across a variety of sample types.
How It Works:
In GC, a vaporized sample is introduced into a column filled with a stationary phase. An inert carrier gas (like helium or nitrogen) propels the sample through the column. Compounds move at different rates depending on their chemical properties, allowing for effective separation and detection.
Common Applications of GC:
Monitoring organic contaminants in drinking water
Analyzing fuels and petroleum derivatives
Detecting pesticide residues in food products
Supporting pharmaceutical analysis and forensic investigations
⚙️ Core Components of a GC System:
Sample injection unit
Separation column (often coiled and housed in a temperature-controlled oven)
Detector (typically FID or TCD)
Temperature regulation system
Data acquisition system (generating chromatograms)
Why Use GC?
Gas Chromatography delivers excellent sensitivity and precision, making it indispensable for research, environmental analysis, and quality assurance. Effective use requires careful sample prep, method optimization, and data interpretation.
#GasChromatography #AnalyticalChemistry #LabEquipment #EnvironmentalTesting #Petrochemicals #WaterAnalysis #PesticideTesting #ForensicScience #ScientificTools #LaboratorySkills
No answers yet.

“Column selection isn’t just one step in method development—it’s the cornerstone of achieving accurate, reliable separations.”
Here are essential tips to guide your column selection process:
1. Understand Your Analyte
Begin with the basics: polarity, pKa, molecular weight, solubility, and chemical stability. For polar compounds, HILIC is ideal. For non-polar compounds, C18 or phenyl columns are typically preferred.
2. Choose the Right Stationary Phase
Start with C18 (ODS), the go-to choice for general applications. If needed, explore C8, phenyl-hexyl, cyano, or polar-embedded phases to fine-tune selectivity.
3. Mind Column Dimensions
Length: Longer columns improve resolution but increase analysis time.
Diameter: Narrow-bore columns (e.g., 2.1 mm) reduce solvent consumption.
Particle Size: Smaller particles (1.7–3 µm) enhance efficiency, but increase system back pressure.
4. Assess pH Stability
When working in acidic or basic conditions, opt for columns with wide pH stability ranges such as hybrid-silica or polymer-based columns.
5. Understand Endcapping
Endcapped columns minimize silanol interactions, which is especially useful for basic analytes. For stronger polar interactions, non-endcapped columns can be advantageous.
6. Ensure System Compatibility
Make sure the selected column is compatible with your detector, mobile phase, and system pressure—particularly when using UHPLC.
7. Use Orthogonal Screening
Test multiple columns with distinct selectivities. This parallel approach speeds up development and improves robustness.
8. Leverage Existing Knowledge
Explore pharmacopeial methods, published research, and manufacturer application notes—many solutions already exist.
Pro Tip: Keep a detailed column log and performance database. It’s a game-changer for future troubleshooting and method reuse.
Thoughtful column selection accelerates development, reduces trial-and-error, and builds regulatory confidence.
Post Credit: Dr. Nilanjana Rana
#HPLC #AnalyticalChemistry #Pharma #MethodDevelopment #QualityControl #Chromatography #UHPLC #ColumnSelection #RnD #HPLCTips
No answers yet.

Need to quickly calculate void volume, void time, or k′ (K prime)? ?
Our HPLC Calculator app now includes an easy-to-use tool for estimating these key parameters in seconds!
Just enter:
Column length (cm)
Internal diameter (mm)
Flow rate (mL/min)
Peak retention time (min)
% Porosity (? Tip: use 70% as default if unsure)
Tap Calculate to get:
✅ Void Volume (mL)
✅ Void Time (min)
✅ K′ value (retention factor)
Whether you're in the lab or validating a method, this tool helps streamline your workflow and eliminate manual math.
Try it now and simplify your HPLC calculations!
No answers yet.
Mobile App
Get the app for mobile access