Download the HPLC Calculator App: The Ultimate HPLC Analysis Tool
Your expert companion for HPLC method development, liquid chromatography troubleshooting, and calculating parameters for both RP-HPLC and UPLC systems.
Get instant access to advanced HPLC calculations and community support
Questions

The Problem: The Pressure vs. Efficiency Trade-off
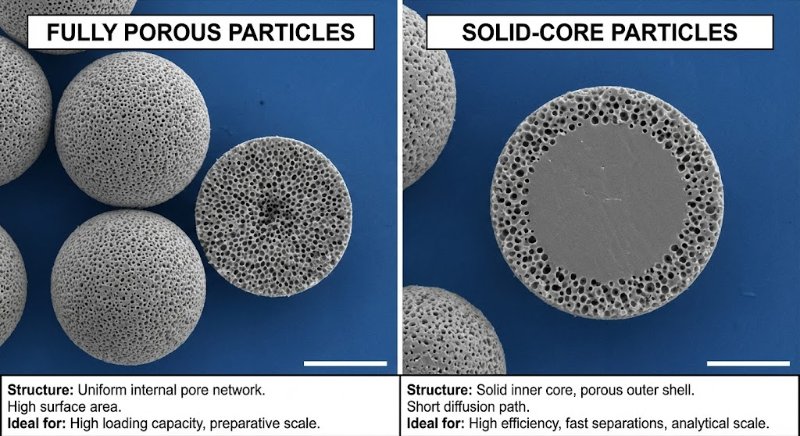
Totally Porous Particles (The Old Standard): These are like "sponges" or "Nerf balls"—pores go all the way through. To get better separation (efficiency), you need smaller particles.
The Trap: As you shrink the particle size (e.g., from 3.5 µm to 1.8 µm) to sharpen peaks, the backpressure skyrockets (often quadruples). Standard HPLC instruments (max ~6000 PSI) cannot handle the pressure required by these sub-2 micron particles.
The Solution: Superficially Porous Particles (SPP)
Also known as Core-Shell or Porous-Shell particles, these offer a "best of both worlds" solution:
The Structure: They have a solid, non-porous core (like a glass marble) coated with a thin porous shell.
Example: A 1.7 µm solid core + a 0.5 µm porous shell = 2.7 µm total particle size.
Why It Works:
Lower Pressure: The pump "sees" a larger 2.7 µm particle, keeping backpressure low enough for standard HPLC instruments.
Higher Efficiency: The sample molecules only have to diffuse through the thin outer shell (short diffusion path). This mimics the physics of a much smaller (~1 µm) particle.
Key Takeaway
Superficially porous columns allow you to achieve UPLC-level efficiency (sharp peaks) using standard HPLC hardware (lower pressure).
No answers yet.
Sustainability in the lab is no longer just a buzzword—in 2025, it’s a necessity. With rising solvent costs and stricter waste regulations, Green Chromatography is becoming the new gold standard in pharmaceutical R&D and QC.
3 Trends defining the Green Shift:
Solvent Swaps: We are seeing successful validations replacing traditional solvents like Acetonitrile and Methanol with greener, bio-renewable alternatives like Ethanol and Dimethyl Carbonate (DMC).
Miniaturization: The shift to micro-LC and nano-LC is cutting solvent consumption by up to 90% without sacrificing resolution.
Core-Shell Efficiency: Using sub-2 µm core-shell particles to speed up runs and drastically reduce mobile phase usage.
It’s not just about saving the planet; it’s about saving the budget.
Call to Action: What’s the biggest challenge you face in making your methods greener? Let's discuss in the comments. ?
#GreenChemistry #HPLC #Sustainability #Laboratory #PharmaRD #GreenHPLC #AnalyticalChemistry #2025Trends
No answers yet.
In analytical method development, particularly for analyzing active pharmaceutical ingredients (APIs) and their impurities, the pKa value of a compound is a fundamental parameter.
Why is pKa so vital?
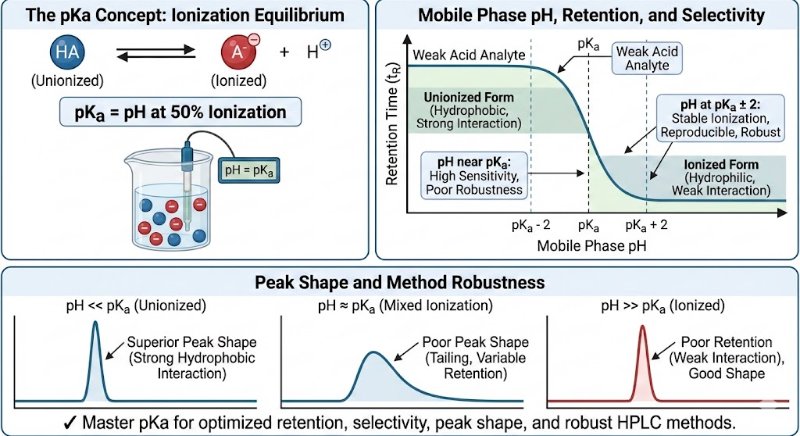
The pKa value is the specific pH at which a molecule exists in a state of equal equilibrium between its ionized and unionized forms (50% ionized, 50% unionized). This balance is crucial because the ionization state directly dictates how a compound interacts with the HPLC system, influencing its retention time, selectivity, and overall peak shape.
Key Applications of pKa in Optimizing HPLC Methods
Strategic Mobile Phase pH Selection:
Choosing a mobile phase pH relative to the analyte's pKa is essential for controlling its ionization state and, consequently, its retention and resolution.
General Guideline: For stable ionization and reproducible chromatography, it is recommended to work at a pH that is at least 2 units away from the pKa value (pKa ± 2).
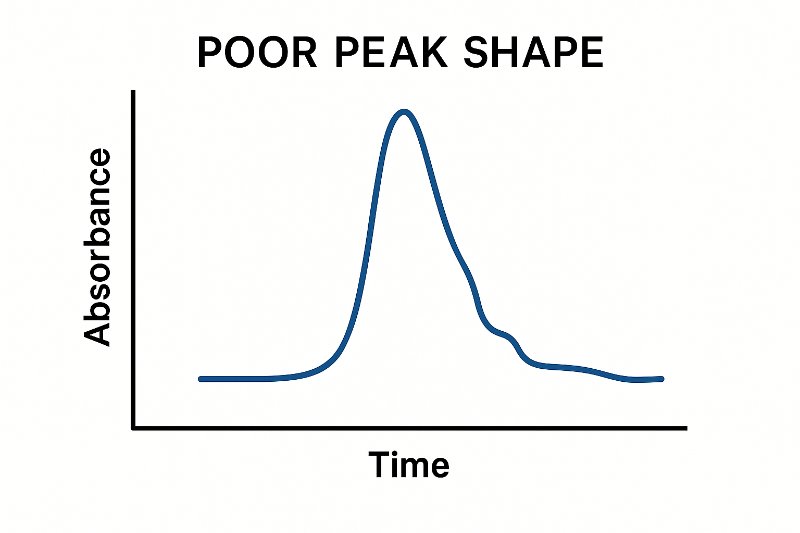
Achieving Superior Peak Shape:
The unionized form of a compound is typically more hydrophobic, allowing for stronger interactions with the stationary phase. This results in sharper, more symmetrical peaks.
Conversely, the ionized form is more hydrophilic and often shows poor retention, leading to undesirable broad, weak, or tailing peaks.
Improving Selectivity Between Analytes:
Compounds with different pKa values can be effectively separated by fine-tuning the mobile phase pH.
Even small adjustments in pH can significantly enhance resolution and selectivity, facilitating the separation of closely eluting peaks.
Ensuring Method Robustness:
A method operating at a mobile phase pH close to an analyte's pKa is highly sensitive to minor pH fluctuations. This can lead to inconsistent retention times and affect system suitability.
Working at a pH away from the pKa makes the method more robust and less susceptible to these small variations.
✔ In Summary: The pKa is more than just a number; it is a powerful guiding tool. By making pKa-driven decisions, analytical scientists can optimize retention, improve selectivity, prevent peak tailing, and ensure the robustness of their HPLC methods, ultimately leading to faster development and more reliable results.
No answers yet.

No answers yet.

Choosing the right buffers and solvents is critical in LC-MS because the entire mobile phase directly enters the mass spectrometer. Compatibility with the ionization source (like ESI or APCI) is essential for high-quality data.
1. Why Volatile Buffers are Essential
Non-volatile salts, such as phosphate buffers, are unsuitable for LC-MS. As the mobile phase evaporates, these salts leave a residue that can:
Contaminate and clog the ion source.
Cause signal suppression.
Increase background noise.
Necessitate frequent and costly maintenance.
Volatile buffers are the solution. They provide stable pH control while being easily removed in the gas phase.
Benefits of Volatile Buffers:
High Sensitivity: They evaporate cleanly, allowing analytes to ionize efficiently without interference.
Low Background: Complete evaporation minimizes background ions, leading to a cleaner spectrum and better signal-to-noise.
System Stability: They prevent the residue buildup that plagues systems using non-volatile salts.
Common Volatile Buffers:
Ammonium Acetate (pH range ~4-6)
Ammonium Formate (pH range ~3-6)
Formic Acid / Acetic Acid (for acidic conditions)
Ammonium Hydroxide (for basic conditions)
2. Why Non-Polar Solvents Should Be Avoided
The choice of organic modifier is equally important. Non-polar solvents (like hexane or toluene) are not recommended for typical reversed-phase LC-MS for several reasons:
Poor Miscibility: Most LC-MS mobile phases are aqueous. Non-polar solvents are immiscible with water, which can cause phase separation.
Low Volatility & Unstable Spray: They do not evaporate efficiently in the MS source, leading to an unstable spray, a noisy baseline, and system contamination.
Ion Suppression: Their low dielectric constant is not conducive to good ion formation in ESI, resulting in poor signal intensity.
Safety Concerns: They often have higher toxicity and flammability.
3. Preferred Solvents for LC-MS
The most commonly used solvents are polar and volatile, such as Methanol and Acetonitrile.
These are ideal because they are:
Fully miscible with water.
Highly volatile, ensuring easy removal in the ion source.
Able to produce stable electrospray droplets, which promotes efficient ionization.
#PharmaceuticalAnalysis #MethodDevelopment #Principle #LCMS #UHPLC #HPLC #GC #GCMS #Volatile_Buffers #Non_polar_solvents #USP #IP #WHO #CDCSO #ICH #MHRA #AnalyticalChemistry #Solactivity #DrugDevelopment #Chemist #validation #science #pharma #GLP #SCIENCE #analytical #scientist #knowledge #sharing
No answers yet.

Excited to announce a powerful new feature in HPLC Calculator app ?
? Fine-tuned on real HPLC problems and solutions
? Aligned with international analytical guidelines
? Helps identify issues, suggest fixes, and optimize methods
Whether you’re facing peak shape issues, retention problems, or compliance challenges, the AI Assistant is designed to provide practical, guideline-based answers.
Available now inside the app — making HPLC analysis smarter and easier than ever!
#HPLC_Calculator
Download it now
Appstore
https://apps.apple.com/eg/app/hplc-calculator/id1600330994
Play store
https://play.google.com/store/apps/details?id=com.Youhana.HPLC_Calculator
No answers yet.

When developing an HPLC method, we often focus on column chemistry, mobile phase composition, and detection. But what happens when the compound itself is chiral?
Enantiomers — mirror-image molecules — behave identically in most achiral environments, which means they often co-elute as a single peak on standard C18 or C8 columns. In biological systems, however, their behavior can be dramatically different:
One enantiomer may provide the therapeutic effect.
The other may be inactive, or even harmful.
This is why regulatory agencies (ICH, FDA, EMA) require chiral separation and quantification during method development and validation. Enantiomeric purity is not only a regulatory requirement but also essential for patient safety and drug efficacy.
Strategies for Chiral Separation in HPLC:
Chiral Stationary Phases (CSPs) – polysaccharide, cyclodextrin, protein, or Pirkle-type columns that enable selective interactions.
Chiral Mobile Phase Additives (CMPAs) – such as cyclodextrins forming transient diastereomeric complexes.
Indirect Approach (Derivatization) – converting enantiomers into diastereomers with chiral reagents (e.g., Marfey’s, Mosher’s) for separation on achiral columns.
Key Considerations in Method Development:
Screening multiple CSPs to identify the best selectivity.
Selecting the appropriate elution mode (normal-phase, reversed-phase, polar organic).
Optimizing pH and temperature to improve resolution.
Ensuring scalability for both analytical and preparative applications.
In modern pharmaceutical analysis, chirality is more than just a separation challenge — it is a critical quality attribute that guarantees both drug safety and efficacy.
For professionals in analytical R&D and QC, developing strong expertise in chiral HPLC method development is essential. Chirality is not just chemistry; it is directly linked to patient safety.
#HPLC #Chirality #MethodDevelopment #AnalyticalChemistry #Pharma #DrugSafety #QualityControl
No answers yet.

No answers yet.

Impurities are unwanted chemicals that may be present in drug substances or finished products as a result of manufacturing, storage, or handling.
Types of Impurities
Process-related → unreacted starting materials, by-products, catalysts.
Degradation-related → formed through heat, oxidation, hydrolysis, or light.
Residual solvents → examples include methanol and dichloromethane.
Enantiomeric impurities → incorrect stereoisomers in chiral drugs.
According to ICH Q3A/Q3B, any impurity at or above 0.1% must be identified, with stricter thresholds for genotoxic impurities.
Identifying Impurities Using HPLC
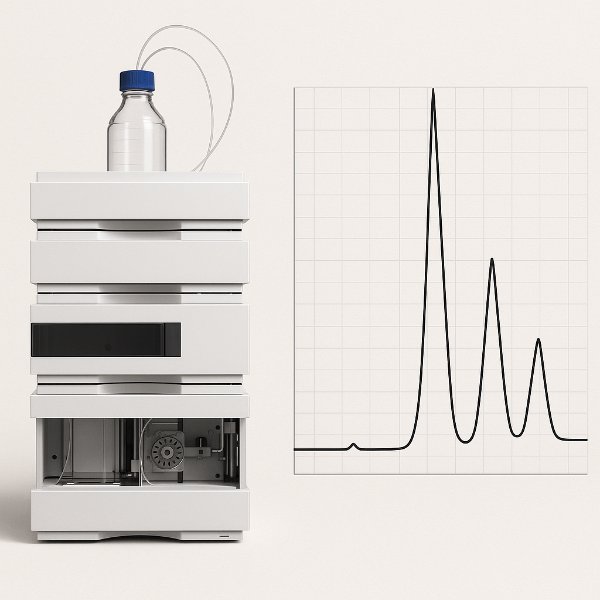
Detection
The main API peak appears alongside smaller impurity peaks.
Characterization
Compare retention times with reference standards.
Use PDA detectors to check peak purity.
Confirm identity by co-injection with standards.
Structural Identification
LC-MS provides molecular weight and fragmentation patterns.
LC-NMR or LC-FTIR supplies structural fingerprints.
Together, these techniques give the complete chemical identity.
Examples of Well-Known Impurities
Nitrosamines (e.g., NDMA, NDEA)
Discovered in valsartan, ranitidine, and metformin between 2018–2019.
Classified as probable human carcinogens.
Regulatory limits are extremely low (nanogram levels).
Identified using HPLC-MS/MS.
p-Aminophenol (Paracetamol)
A toxic degradation product affecting liver and kidney.
Strictly limited to ≤0.1%.
Formaldehyde / Acetaldehyde
Residual solvent-related impurities found in excipients.
Detected using derivatization followed by HPLC.
Epimer impurities in chiral drugs
Wrong stereoisomers can be inactive or harmful.
The thalidomide case highlighted the risks.
Controlled and identified using chiral HPLC columns.
Why Impurity Profiling is Essential
Patient safety → prevents toxic exposure.
Regulatory compliance → required by ICH and FDA.
Process understanding → reveals weaknesses in synthesis or storage.
Shelf-life assurance → guarantees product safety until expiry.
Key Takeaway
Finding an extra peak in an HPLC chromatogram is only the first step. Comprehensive quality control requires:
Detection – observing the impurity peak.
Identification – determining chemical structure with advanced techniques.
Control – ensuring levels remain below regulatory limits.
No answers yet.

Serial dilution is a fundamental laboratory technique used to reduce concentration step by step. It ensures accurate analysis of pharmaceutical compounds, supports method validation, and provides consistency across regulatory standards.
What is Serial Dilution?
Serial dilution involves repeatedly diluting a solution by a fixed factor (commonly 1:10 or 1:100) using a solvent. This creates a series of decreasing concentrations and is widely applied in:
Analytical method validation
Microbiological assays
Pharmaceutical quality control
Why is it Essential?
Precision: Enables preparation of reliable low-concentration standards for calibration and testing.
Consistency: Provides uniform preparation to support inter-laboratory reproducibility and compliance with regulatory requirements.
Versatility: Useful for preparing standards, quantifying active ingredients, and studying dose-response relationships.
Step-by-Step Guide
Prepare a stock solution by accurately weighing or measuring the compound and dissolving it in a suitable solvent.
Dilute sequentially by transferring a fixed volume of the stock into successive containers with solvent, mixing thoroughly at each step.
Document concentrations carefully to ensure traceability and accuracy.
Serial dilution is not just a routine laboratory practice—it is a strategic process that underpins precision, reliability, and the success of pharmaceutical research and regulatory compliance.
#PharmaceuticalScience #MethodValidation #SerialDilution #LabTechniques #RegulatoryAffairs #DrugDevelopment #LinkedInLearning #Labtip #analytical #HPLC #RP_HPLC #FTIR #Pharmaceutical_sciences #drugs
No answers yet.

High-Performance Liquid Chromatography (HPLC) is one of the most critical analytical techniques in the pharmaceutical industry. To ensure accuracy, reliability, and compliance with regulatory requirements, HPLC calibration should be performed at regular intervals, typically every six months.
Essential calibration parameters and acceptance criteria:
Flow rate accuracy: Within ±0.5% of the set flow rate
Injector precision: %RSD of retention time and peak area ≤ 1.0%
Injector linearity: Correlation coefficient ≥ 0.99
Detector wavelength accuracy: Absorption maxima/minima must fall within specified wavelength tolerances
Detector linearity: Correlation coefficient ≥ 0.99
Gradient composition accuracy: %RSD ≤ 3.0%
Carry-over: ≤ 0.1% (may differ depending on company procedures)
Column oven temperature accuracy: Within ±2 °C of the set value
Baseline drift and noise: Drift ≤ 0.01 AU/hr; Noise ≤ 0.000125 AU
Why it matters:
Regular calibration ensures data integrity, reproducibility, and compliance with GMP requirements. It strengthens confidence in analytical results, supports regulatory audits, and ensures that decisions based on HPLC data are scientifically sound.
Recommended frequency: Every 6 months, or as defined in internal quality systems.
Consistent calibration leads to consistent results and reliable decision-making in pharmaceutical development and quality control.
No answers yet.

Q: Why is the HPLC baseline noisy?
A: Common reasons include air bubbles in the system, an aging detector lamp, a contaminated flow cell, or impurities in the mobile phase.
#BaselineTroubleshooting
Q: What causes a drifting baseline?
A: Likely factors are temperature variations, changes in mobile phase composition, or instability in the detector lamp.
Q: Why do ghost peaks appear during blank runs?
A: Possible sources include mobile phase contamination, carryover from earlier injections, or memory effects from the column.
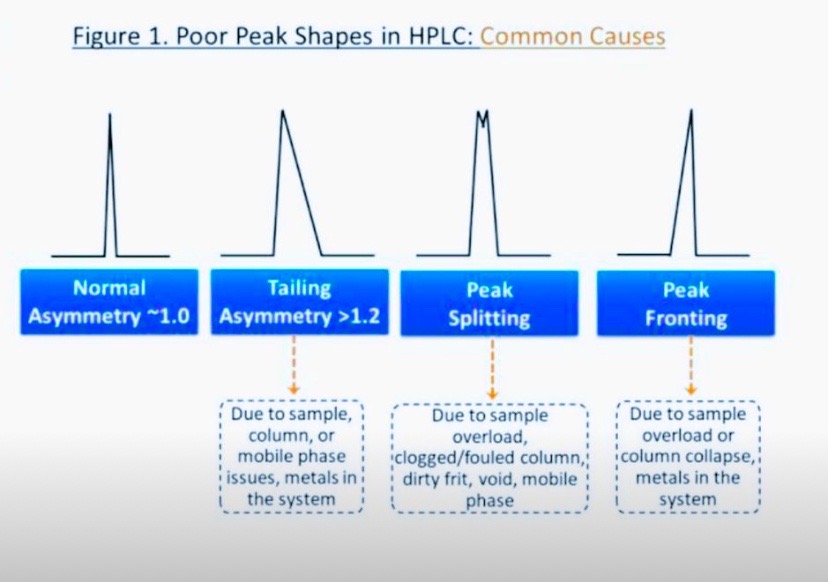
Q: Why are my peaks splitting?
A: Causes may include overloading the column, mismatch between sample solvent and mobile phase, or unintended double injection.
#PeakSplitting #ColumnOverload
Q: What leads to fronting (leading peaks)?
A: Often due to column overload, poor packing quality, or injecting too large a sample volume.
Q: Why do I observe peak tailing?
A: This can result from strong interactions between analytes and the stationary phase or from column degradation.
#PeakTailing #ColumnTroubleshooting
Q: Why is retention time shifting?
A: Typically caused by inconsistent mobile phase composition, temperature changes, or an aging column.
#RetentionShift
Q: What results in low detector sensitivity?
A: A dirty detector cell, an old lamp, poor sample preparation, or low analyte concentration.
#HPLCDetection
Q: What causes high system pressure?
A: Blocked frits, a contaminated column, or clogged tubing are common culprits.
Q: Why is the system pressure low?
A: Could be due to leaks, worn pump seals, or an empty solvent reservoir.
Q: Why is there no flow from the pump?
A: Causes include air locks, a dry pump, or mechanical pump failure.
#HLPCPump
Q: Why is the pump making noise?
A: May be caused by air trapped in the system, worn piston seals, or malfunctioning check valves.
#PumpNoise
Q: Why is the detector unresponsive?
A: Check for a powered-off lamp, disconnected signal cables, or a defective detector.
#DetectorFail #NoSignal
Q: What causes air bubbles in the detector cell?
A: Insufficient degassing, loose connections, or small system leaks.
#AirBubbles
Q: Why is the peak area inconsistent?
A: Potential causes include autosampler errors, a faulty syringe, or inconsistent injection volumes.
#PeakArea
Q: What causes sudden changes in peak shape?
A: Likely due to column contamination or an unexpected change in the mobile phase.
Q: Why has column backpressure suddenly increased?
A: May be caused by precipitation from the sample matrix or mobile phase blocking the column.
Q: What leads to broad peaks?
A: Reasons include overloading the column, using an old or worn column, or operating at a slow flow rate.
Q: Why is there carryover in blank runs?
A: Inadequate needle wash, sticky analytes, or a contaminated injection needle may be responsible.
#Carryover
Q: What causes variability in retention times?
A: Often due to inconsistent flow rates or variations in mobile phase composition.
Q: Why isn’t the gradient working as expected?
A: Possible causes include gradient valve malfunctions, incorrect software settings, or air bubbles in the solvent lines.
Q: What causes leakage near the detector?
A: Most likely due to loose fittings or a cracked detector flow cell.
Q: Why are sample peaks missing?
A: Could be due to sample degradation, incorrect detector wavelength, or failed injection.
Q: What causes baseline oscillations?
A: Usually due to pump pulsations or trapped air within the system.
Q: Why do I see extra peaks in the chromatogram?
A: Potential causes include sample or system contamination, or ghost peaks from previous runs.
No answers yet.
Think about the pKa of basic drugs – how are they charged at low pH?
Consider the stationary phase – what happens when silanol groups are not masked?
Peak fronting/tailing + retention issues = possible secondary interactions or ionization mismatch.
Which condition increases interaction with residual silanols?

“Column selection isn’t just one step in method development—it’s the cornerstone of achieving accurate, reliable separations.”
Here are essential tips to guide your column selection process:
1. Understand Your Analyte
Begin with the basics: polarity, pKa, molecular weight, solubility, and chemical stability. For polar compounds, HILIC is ideal. For non-polar compounds, C18 or phenyl columns are typically preferred.
2. Choose the Right Stationary Phase
Start with C18 (ODS), the go-to choice for general applications. If needed, explore C8, phenyl-hexyl, cyano, or polar-embedded phases to fine-tune selectivity.
3. Mind Column Dimensions
Length: Longer columns improve resolution but increase analysis time.
Diameter: Narrow-bore columns (e.g., 2.1 mm) reduce solvent consumption.
Particle Size: Smaller particles (1.7–3 µm) enhance efficiency, but increase system back pressure.
4. Assess pH Stability
When working in acidic or basic conditions, opt for columns with wide pH stability ranges such as hybrid-silica or polymer-based columns.
5. Understand Endcapping
Endcapped columns minimize silanol interactions, which is especially useful for basic analytes. For stronger polar interactions, non-endcapped columns can be advantageous.
6. Ensure System Compatibility
Make sure the selected column is compatible with your detector, mobile phase, and system pressure—particularly when using UHPLC.
7. Use Orthogonal Screening
Test multiple columns with distinct selectivities. This parallel approach speeds up development and improves robustness.
8. Leverage Existing Knowledge
Explore pharmacopeial methods, published research, and manufacturer application notes—many solutions already exist.
Pro Tip: Keep a detailed column log and performance database. It’s a game-changer for future troubleshooting and method reuse.
Thoughtful column selection accelerates development, reduces trial-and-error, and builds regulatory confidence.
Post Credit: Dr. Nilanjana Rana
#HPLC #AnalyticalChemistry #Pharma #MethodDevelopment #QualityControl #Chromatography #UHPLC #ColumnSelection #RnD #HPLCTips
No answers yet.
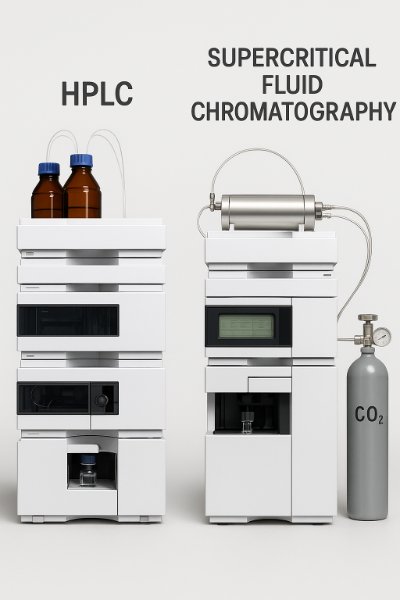
Supercritical Fluid Chromatography (SFC) often takes center stage as a “green” technique, thanks to its use of supercritical CO₂. But let’s be honest — sustainability is more than just one solvent. It’s about the full picture: solvent usage, energy demands, waste, and recovery systems. Here's a grounded view ?
✅ Where SFC Supports Green Chemistry
♻️ CO₂ as main mobile phase → reduces organic solvent usage
⚡ Faster runs → lower energy + higher throughput
Lower toxicity & flammability than fully organic systems
Great for chiral & non-polar compounds — when properly optimized
⚠️ Where SFC May Miss the Mark
High co-solvent use (≥45–50%) undermines the green edge
No co-solvent recovery = more waste + more cost
CO₂ often vented instead of recycled — less sustainable
High flow rates in prep mode → excessive consumption unless carefully managed
Recovery & Recycling: The Real Green Commitment
To truly make SFC (or even HPLC) green, recovery systems are essential:
Co-Solvent Recovery
♻️ Reclaim methanol/ethanol to cut waste and costs
Key for both environmental compliance and sustainability
CO₂ Recycling
Closed-loop systems compress, clean, and reuse CO₂
Reduces emissions and supports a circular chromatography model
❗Without recovery, “green SFC” is more illusion than reality.
Sustainable Method Development: Start Smart
✅ Keep modifiers ≤25% when possible
Begin scouting with biodegradable solvents
Use gradient delays to minimize early CO₂ loss
Choose the right column to avoid repeat runs
Optimize the whole process — not just speed or selectivity
SFC vs. HPLC? No Rivalry, Just the Right Tool
Base your method on your mission:
Compound polarity & complexity
Availability of recovery systems
⏱️ Throughput needs
Sustainability goals
A data-driven approach ensures both performance and environmental responsibility ??
SFC’s Strengths — When Recovery Is In Place
Ultra-fast separations
Reduced solvent waste
Effective for chiral purification
CO₂ = cheap, inert, recyclable
Safer than all-organic setups
Final Note:
These insights are derived from real-world experience in method development across analytical and preparative-scale chromatography. I’m not pushing any one platform — just opening the door for honest, practical dialogue.
What’s your perspective on SFC in green science?
Are you integrating recovery systems? Let’s share, improve, and grow together. ?
No answers yet.
No answers yet.
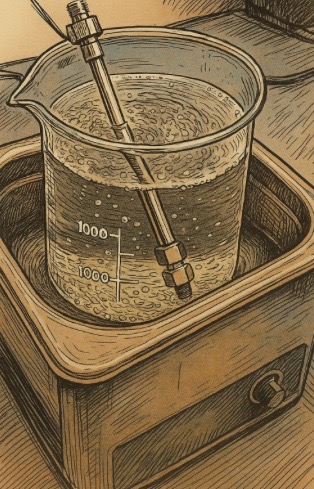
Are you struggling with clogged HPLC columns, peak tailing, or rising backpressure? Traditional flushing methods may not always be enough. Let's explore how **ultrasound sonochemistry** can breathe new life into your columns-saving time, solvent, and costs!
What is Sonochemistry?**
Sonochemistry uses **high-frequency sound waves (20 kHz-1 MHz)** to enhance chemical and physical processes. In HPLC, it leverages **acoustic cavitation**-
the formation and violent collapse of microscopic bubbles
-to dislodge contaminants from column packing.
**Why it works**:
**Cavitation bubbles** generate localized **micro-jets and shockwaves** (~1000 atm, 5000 K).
**Enhanced mass transfer** helps dissolve stubborn residues.
Ultrasound vs. Traditional Washing**
**Advantages of Ultrasound**:
- **3x faster** than gradient flushing.
**Removes deeply adsorbed contaminants** (e.g., lipids, polymers).
- **Reduces solvent use** (greener alternative).
▲ **Caution**:
- Avoid excessive power/duration to prevent **frit damage**.
- Not recommended for **chiral or polymeric columns** without validation.
No answers yet.

Need to quickly calculate void volume, void time, or k′ (K prime)? ?
Our HPLC Calculator app now includes an easy-to-use tool for estimating these key parameters in seconds!
Just enter:
Column length (cm)
Internal diameter (mm)
Flow rate (mL/min)
Peak retention time (min)
% Porosity (? Tip: use 70% as default if unsure)
Tap Calculate to get:
✅ Void Volume (mL)
✅ Void Time (min)
✅ K′ value (retention factor)
Whether you're in the lab or validating a method, this tool helps streamline your workflow and eliminate manual math.
Try it now and simplify your HPLC calculations!
No answers yet.
1. Column Maintenance:
Regular column cleaning: Clean the column regularly to remove contaminants.
Column regeneration: Regenerate the column according to the manufacturer's instructions.
2. Mobile Phase Optimization:
pH adjustment: Adjust the pH of the mobile phase to optimize the ionization state of the analyte.
Buffer concentration: Optimize the buffer concentration to reduce ionic interactions.
Organic modifier: Adjust the type and concentration of organic modifier.
3. Sample Preparation:
Sample cleanup: Clean up the sample to remove impurities that may cause tailing.
Sample solven: Use a sample solvent that is compatible with the mobile phase.
4. Column Selection:
Choose the right column: Select a column that is suitable for the analyte and mobile phase.
Column type: Consider using a column with a different bonding chemistry or particle size.
5. Instrument Optimization:
Injector optimization: Optimize the injector settings to reduce sample dispersion.
Detector settings: Adjust the detector settings to optimize peak shape.
6. Method Optimization:
Gradient optimization: Optimize the gradient to improve peak shape.
Flow rate: Adjust the flow rate to optimize peak shape.
No answers yet.
In pharmaceutical analysis, accurately determining the Limit of Detection (LOD) and Limit of Quantitation (LOQ) is essential during method validation—especially for detecting impurities and quantifying trace-level components.
What Are LOD and LOQ?
✅ LOD is the lowest concentration of an analyte that can be reliably detected, though not necessarily measured.
✅ LOQ is the lowest concentration that can be quantified with acceptable precision and accuracy.
Common Methods for Determining LOD & LOQ
(As per ICH Q2(R2) guidelines)
1. Signal-to-Noise Ratio (S/N) Method
LOD: S/N ≈ 3:1
LOQ: S/N ≈ 10:1
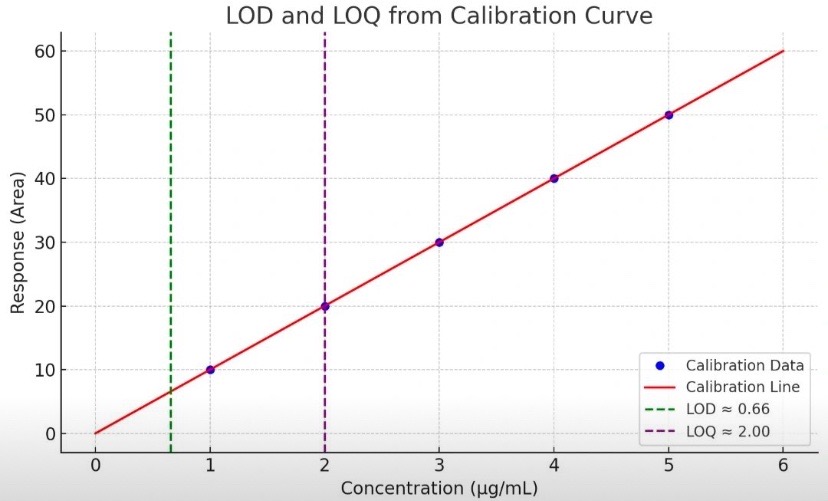
2. Standard Deviation and Slope Method (σ/S)
A linear calibration curve is plotted with:
X-axis: Concentration (e.g., ppm or µg/mL)
Y-axis: Instrument response (e.g., peak area or height)
Then use:
LOD = 3.3 × (σ/S) → Point just above the noise level
LOQ = 10 × (σ/S) → Lowest reliably quantifiable point
Graph details:
Green dashed line: LOD
Purple dashed line: LOQ
Red line: Calibration curve
3. Visual Evaluation or Dilution Method
Particularly useful for non-instrumental techniques—LOD and LOQ are estimated by observing the analyte's detectability at decreasing concentrations.
✔️ Why Is It Important?
Accurate determination of LOD and LOQ ensures compliance with regulatory standards (ICH Q2(R2)), and is critical for monitoring impurities that may impact the safety and efficacy of pharmaceutical products.
Best Practices:
Always use freshly prepared standards
Evaluate LOD/LOQ during precision and recovery studies
Ensure good peak shape and clear baseline resolution
No answers yet.
Mobile App
Get the app for mobile access