Download the HPLC Calculator App: The Ultimate HPLC Analysis Tool
Your expert companion for HPLC method development, liquid chromatography troubleshooting, and calculating parameters for both RP-HPLC and UPLC systems.
Get instant access to advanced HPLC calculations and community support


Questions

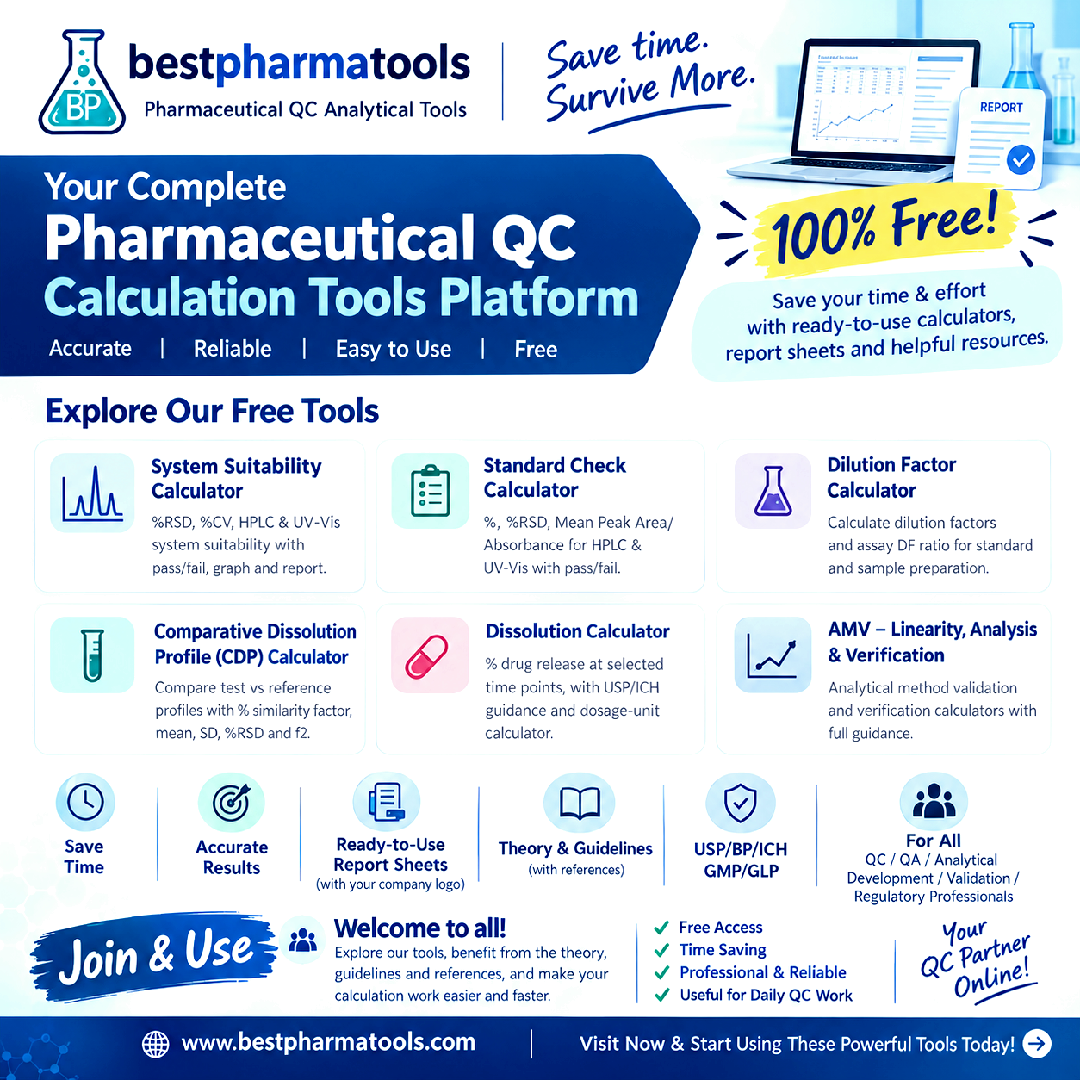
Explore Free Pharmaceutical QC Analytical Tools
Welcome to BestPharmaTools.com — your online platform for pharmaceutical QC calculations, analytical guidance, and time-saving tools.
Use practical, easy-to-use calculators designed to make routine pharmaceutical analytical calculations faster, clearer, and more convenient.
Available Tools & Their Benefits
1. System Suitability Calculator
Quickly calculate %RSD and %CV for HPLC and UV-Vis replicate injections with automatic Pass/Fail evaluation, graphical presentation, and report-ready results.
➡️ Useful for routine system suitability assessment and documentation.
2. Standard Check Calculator
Calculate Standard Check %, %RSD, and Mean Peak Area/Absorbance for HPLC and UV-Vis.
➡️ Helps simplify routine standard performance checks and provides quick acceptance evaluation.
3. Dilution Factor Calculator
Calculate dilution factors and assay dilution-factor ratios for standard and sample preparations.
➡️ Reduces manual calculation errors and makes multi-step dilution calculations easier to follow.
4. Comparative Dissolution Profile (CDP) Calculator
Compare Test vs Reference dissolution profiles and calculate % release, Mean, SD, %RSD, and f₂ similarity factor.
➡️ Makes CDP data evaluation faster and more organized.
5. Dissolution Calculator
Calculate % drug release at single or multiple time points, including Mean, SD, %RSD, and applicable Stage 1/2/3 evaluation.
➡️ Includes dissolution calculations according to dosage form and supports easier interpretation of dissolution results.
6. AMV – Analytical Method Validation/Verification Calculators
A dedicated hub covering important analytical validation parameters such as:
System Suitability • Specificity • Linearity • Range • Accuracy • Precision • Solution Stability • Robustness • LOD & LOQ • Forced Degradation
➡️ Helps analytical professionals perform and understand validation-related calculations more efficiently.
Don't Just Calculate — Understand the Science
Along with calculators, BestPharmaTools.com provides theory, explanations, guidelines, and references to help you understand why and how each calculation is performed.
Explore relevant concepts with references to applicable USP, BP, ICH, and GMP/GLP guidance, wherever applicable, so you can use the tools while also strengthening your technical understanding.
Save Time on Documentation
Where available, use printable/report-ready outputs to make your calculation work easier and more organized.
Who Can Use These Tools?
Designed for:
QC | QA | Analytical Development | Method Validation | Regulatory Affairs | Pharmaceutical Professionals | Students & Researchers
■ Free to explore and use
⏱️ Save time
■ Simplify calculations
■ Learn from theory & guidelines
■ Explore references
■ Make reporting easier
Welcome everyone to explore, learn, calculate, and make pharmaceutical analytical work easier with BestPharmaTools.com.
Visit: BestPharmaTools.com
No answers yet.
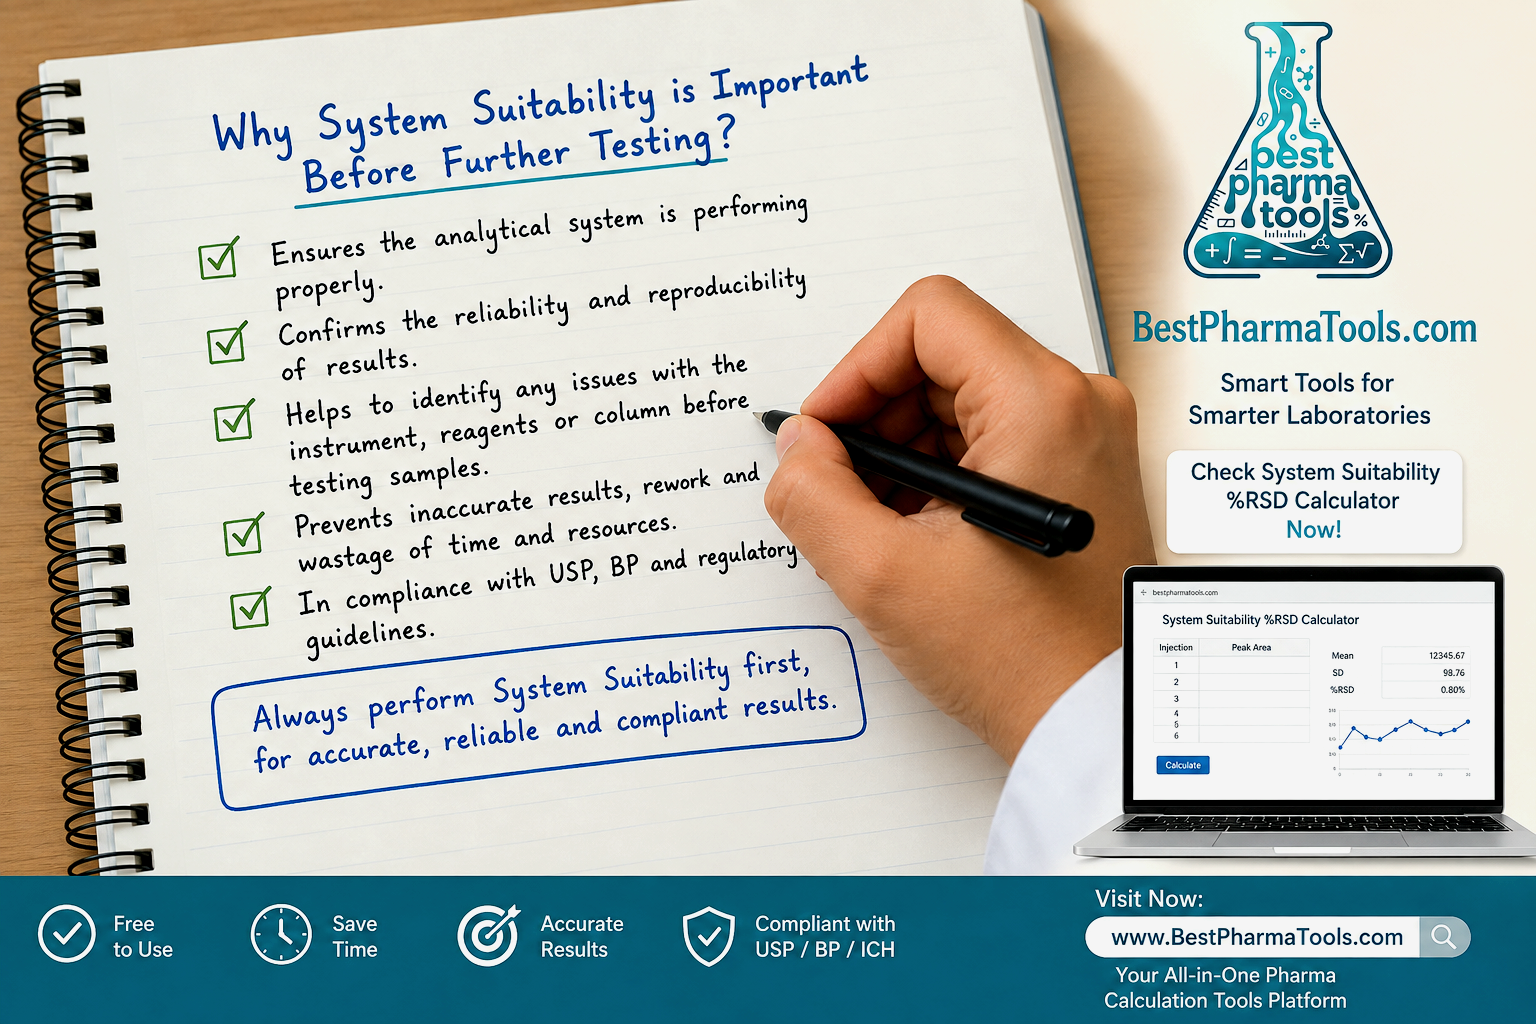
System Suitability Calculator — %RSD, %CV, Theoretical Plates, Tailing, Resolution & S/N Ratio
No answers yet.

Understanding chromatographic resolution (Rs) is crucial for accurate analysis! ? Watch how two overlapping peaks separate to achieve baseline resolution. Rs is a measure of the separation between two peaks relative to their widths (W1 and W2). Clear separation means reliable data! ?
#HPLC #Chemistry #Chromatography #ScienceEducation
No answers yet.
No answers yet.
Particular or frequenting tests on mass?
No answers yet.

Hello everyone,
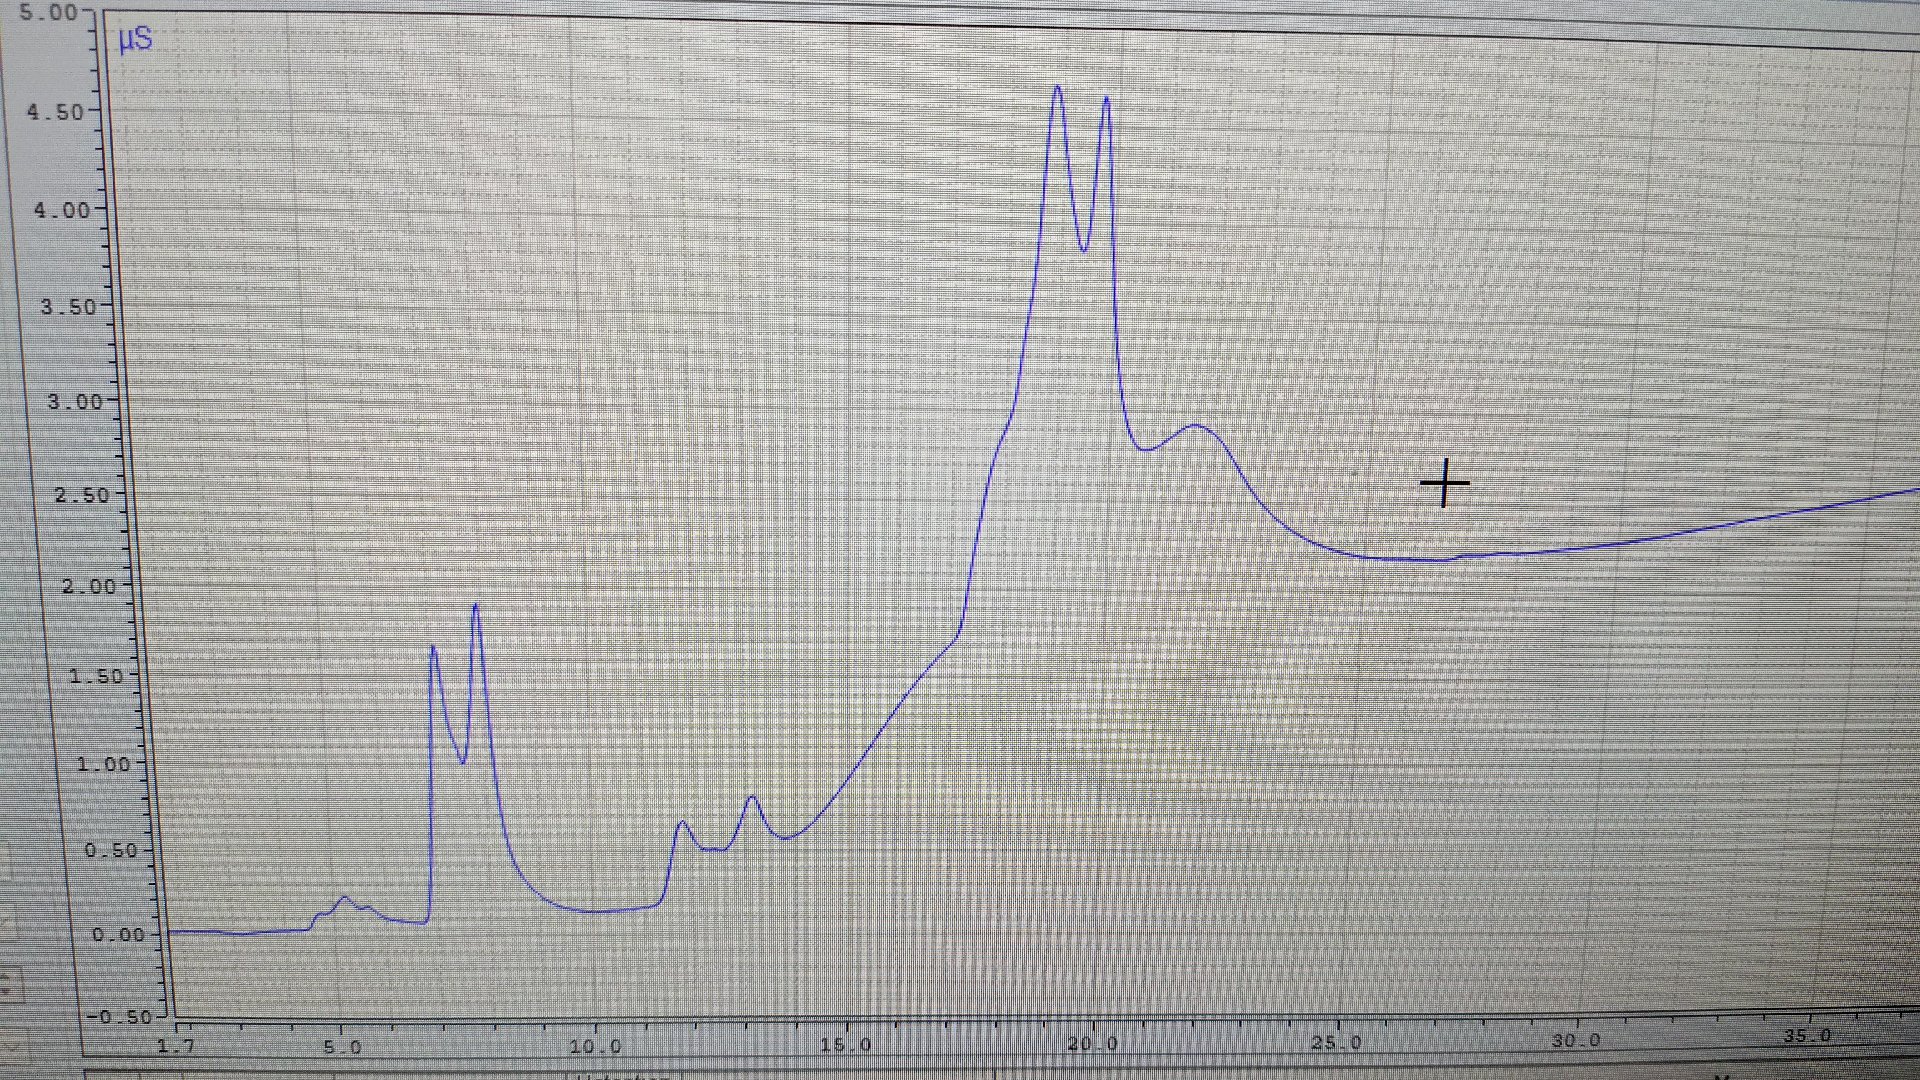
I am a new lab technician, and I'm analyzing anions with an IC equipment such as Cloride, nitrate, sulfate. My peak data has peak shapes like image I give above. How can I solve this problem? Please help me this problem. Thank for your help!
No answers yet.
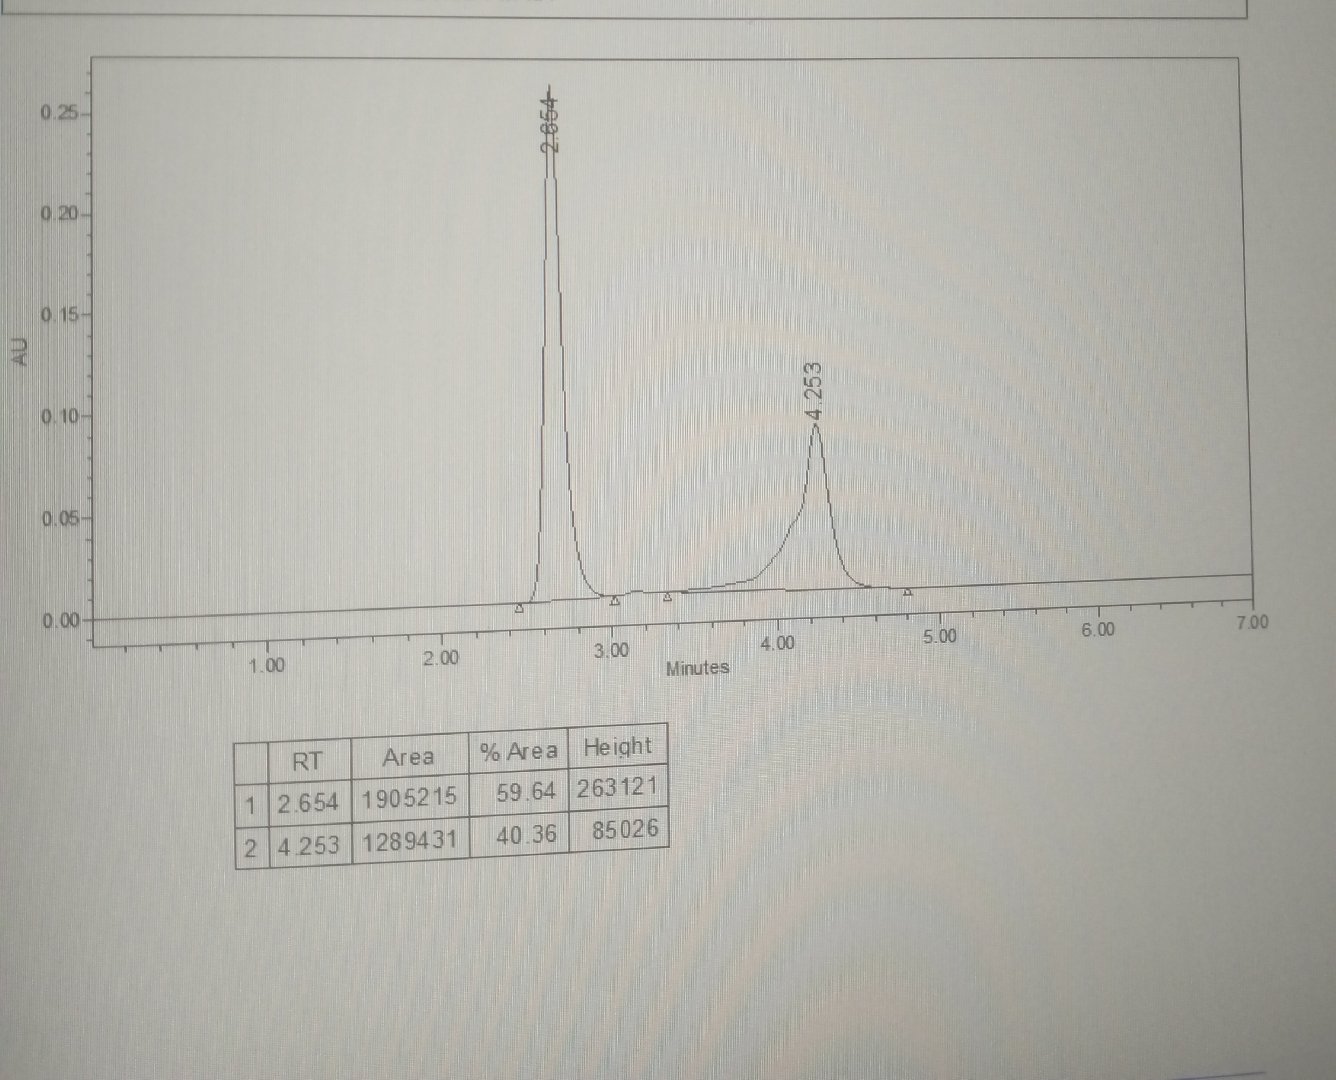
Please help me with this
I am using ammonium acetate pH 5.5: ACN
(40:60)
1ml/min
I tried changing all the parameters but still getting fronting
TheOption Live
2 m ago
Peak fronting is due to sample overloading and solvent mismatch (high ACN content).
It can be minimized by reducing injection volume, diluting sample, and preparing sample in mobile phase.
I would be happy to receive the service manual for the NMR DD2 Platform if you have it available. Please send it to me at the following email address: ghorbanzadehali86@gmail.com
No answers yet.
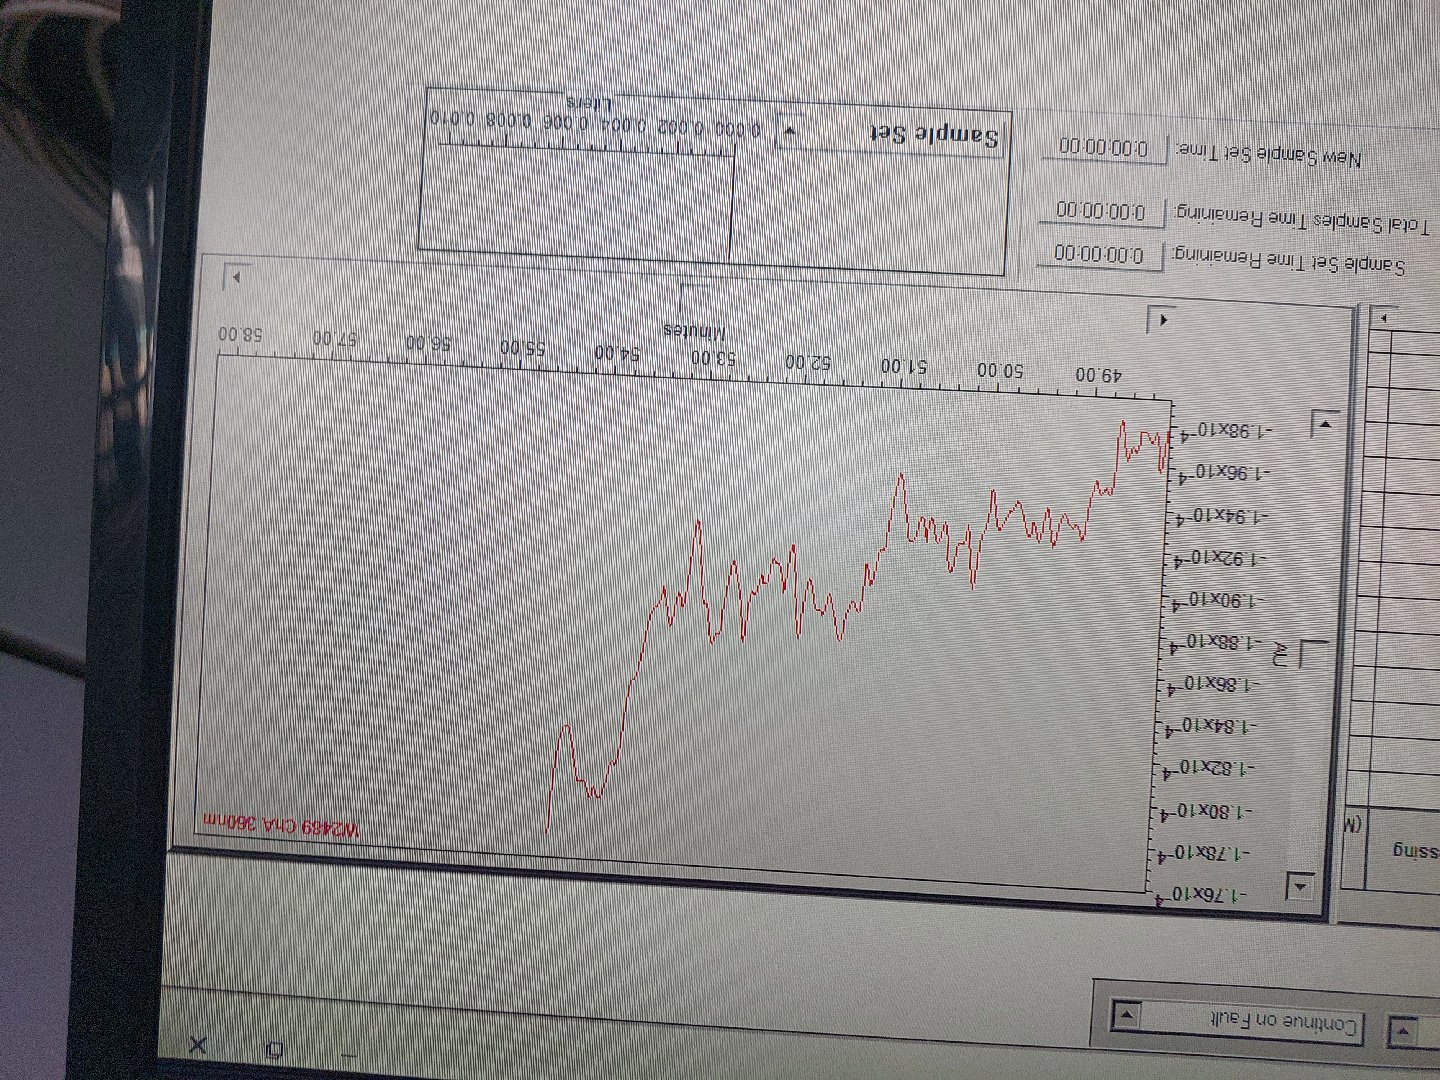
What could be causing this drift in baseline, I've tried changing mobile phase, degassing, temp is stable, proper purging with mobile phase
youhana Hosny
4 m ago
scall is very very small
Good morning to all. Now I'm trying to develop quantification method for lysine aescinate injection by HPLC. Lysine peak in not eluting. If someone knows about these method parameters, please help me.
Sunnatulla Tugizboyev
9 m ago
Primesep 100 column with UV 210 nm it is working only lysine standard.
youhana Hosny
9 m ago
it can’t be detected on uv detector
are using uv detector ?
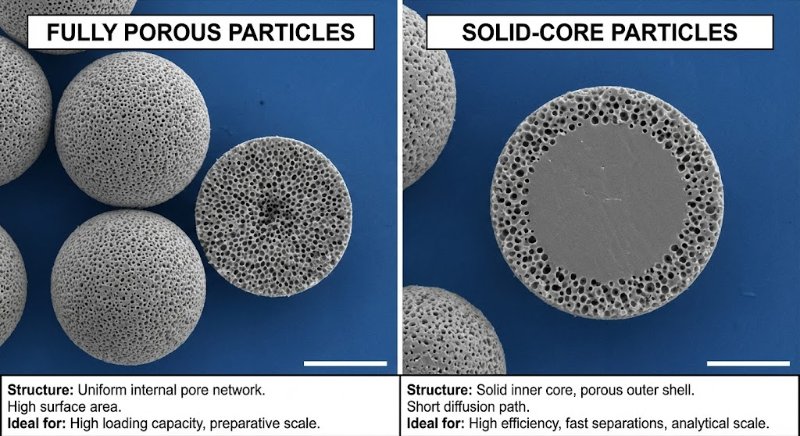
The Problem: The Pressure vs. Efficiency Trade-off
Totally Porous Particles (The Old Standard): These are like "sponges" or "Nerf balls"—pores go all the way through. To get better separation (efficiency), you need smaller particles.
The Trap: As you shrink the particle size (e.g., from 3.5 µm to 1.8 µm) to sharpen peaks, the backpressure skyrockets (often quadruples). Standard HPLC instruments (max ~6000 PSI) cannot handle the pressure required by these sub-2 micron particles.
The Solution: Superficially Porous Particles (SPP)
Also known as Core-Shell or Porous-Shell particles, these offer a "best of both worlds" solution:
The Structure: They have a solid, non-porous core (like a glass marble) coated with a thin porous shell.
Example: A 1.7 µm solid core + a 0.5 µm porous shell = 2.7 µm total particle size.
Why It Works:
Lower Pressure: The pump "sees" a larger 2.7 µm particle, keeping backpressure low enough for standard HPLC instruments.
Higher Efficiency: The sample molecules only have to diffuse through the thin outer shell (short diffusion path). This mimics the physics of a much smaller (~1 µm) particle.
Key Takeaway
Superficially porous columns allow you to achieve UPLC-level efficiency (sharp peaks) using standard HPLC hardware (lower pressure).
No answers yet.
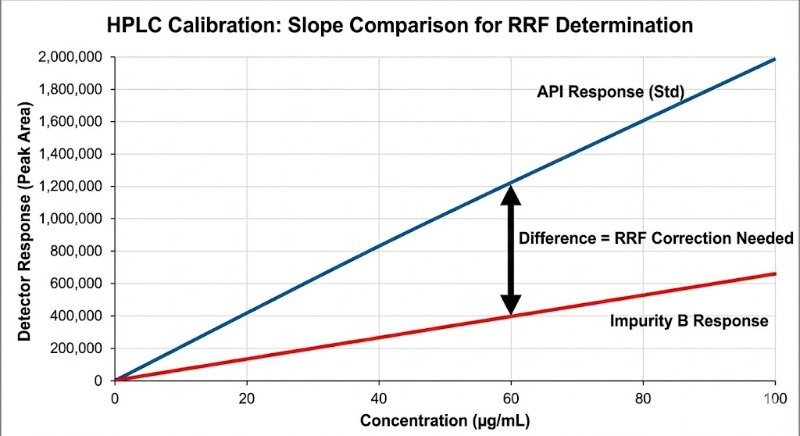
In HPLC analysis, the biggest lie a chromatogram can tell you is that "bigger peak = more amount."
We all know that different molecules interact with detectors differently. Yet, assuming a Relative Response Factor (RRF) of 1.0 for impurities is still a common shortcut that can lead to dangerous under- or over-estimation of toxic impurities.
Why RRF Determination is Non-Negotiable:
Chromophore Differences: Just because it’s an isomer doesn’t mean it absorbs UV light the same way.
Wavelength Sensitivity: An RRF valid at 254 nm might be completely wrong at 210 nm.
Regulatory Impact: ICH guidelines (Q3A/Q3B) often require correction factors if the response differs by more than 10-20% (0.8–1.2).
The "Slope Method" Gold Standard: To get a true RRF, avoid the single-point check. You need to compare the slopes of the linearity curves (Impurity vs. API) to rule out matrix effects and intercept bias.
RRF = Slope (Impurity) / Slope (API)
If you aren't correcting for response factors, are you really quantifying? Or are you just guessing?
How does your lab handle RRFs for unknown impurities? Do you default to 1.0 or run full slope-method determinations?
No answers yet.
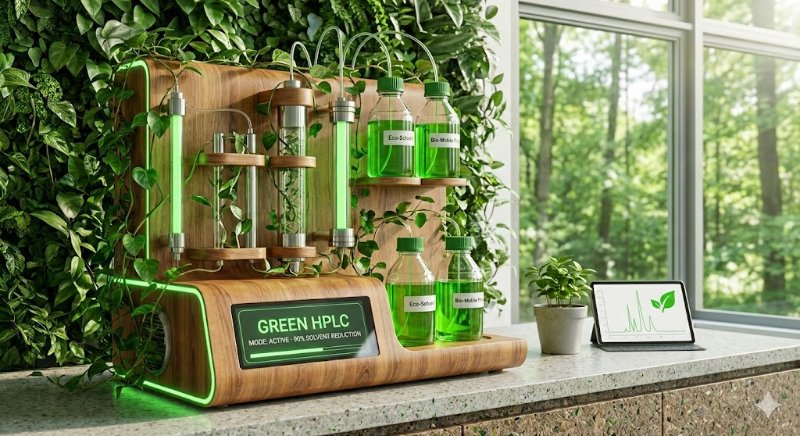
Sustainability in the lab is no longer just a buzzword—in 2025, it’s a necessity. With rising solvent costs and stricter waste regulations, Green Chromatography is becoming the new gold standard in pharmaceutical R&D and QC.
3 Trends defining the Green Shift:
Solvent Swaps: We are seeing successful validations replacing traditional solvents like Acetonitrile and Methanol with greener, bio-renewable alternatives like Ethanol and Dimethyl Carbonate (DMC).
Miniaturization: The shift to micro-LC and nano-LC is cutting solvent consumption by up to 90% without sacrificing resolution.
Core-Shell Efficiency: Using sub-2 µm core-shell particles to speed up runs and drastically reduce mobile phase usage.
It’s not just about saving the planet; it’s about saving the budget.
Call to Action: What’s the biggest challenge you face in making your methods greener? Let's discuss in the comments. ?
#GreenChemistry #HPLC #Sustainability #Laboratory #PharmaRD #GreenHPLC #AnalyticalChemistry #2025Trends
No answers yet.
Suggest Mobile Phase for Sertraline HCl Impurity Method for, with good separation between "USP Sertaline HCl Racemic Mixture and Sertraline HCl".
No answers yet.
Required naproxen sodium Assay Alternate method in UV Spectro.
Diluent=?
UV spectro parameters=?
Babak Astani
9 m ago
Hi
Diluent:dissolve 13.6 g KH2PO4 in 2000 ml water and adjust pH to 6.8 with NaOH.
Standard Solution:
25 mg of Naproxen in 50 ml, first add 5 ml Methanol and add Diluent to 50ml. after that 5 ml of this solution transfer to 100 ml and fill with water.
Test solution:
weight Equivalent 250 mg naproxen in 100 ml, add 5 ml Methanol to Dissolve Naproxen after that add diluent to volume 100ml.then transfer 1ml of solution to volumetric flask and add water to volume 100.
Blank is water.
wavelength: 263nm
During batch file run after five std. Run pressure drop occurs due to which shift in RT. How can we file an incident report. What reason and explanation and remedies we file
youhana Hosny
10 m ago
Is there any source of leak detected ?
Babak Astani
10 m ago
✅ Incident Report – HPLC Pressure Drop & RT Shift
1) What happened (Incident Description)
During a batch sequence, after the injection of five standards, a sudden pressure drop occurred in the HPLC system. Following the pressure drop, a shift in retention time (RT) was observed for subsequent standard injections and samples. The batch was stopped, and the issue was investigated.
✅ 2) Probable Cause(s)
A) Partial blockage dislodged → sudden flow increase → pressure drop
Sometimes a partially clogged column, guard column, or inline filter gets cleared suddenly.
When the blockage clears, backpressure drops and retention times shift to lower RT because of increased actual flow.
B) Leak in the system
A loose fitting, worn ferrule, or micro-leak in pump head or column inlet can reduce pressure.
Leak causes unstable flow → RT shift.
C) Pump malfunction / air bubble
Air bubble entering pump head reduces pressure and flow.
Causes inconsistent RT.
D) Mobile phase composition shift
Sudden change in gradient accuracy due to pump mixing issue.
Leads to RT drift and pressure change.
✅ 3) Explanation (Technical Justification)
HPLC pressure is directly linked to flow resistance across the column.
A sudden pressure drop indicates reduced flow resistance, typically due to:
Clearance of blockage,
Leak formation, or Pump instability.
Retention times shifted because the actual flow rate changed even though set flow seemed unchanged.
This directly impacts chromatographic performance and validity of the batch.
✅ 4) Remedies / Corrective Actions (CA)
You can list these:
1. Checked entire fluidic path (inlet filter → pump → mixer → injector → column → detector) for leaks.
2. Tightened all fittings and replaced worn ferrules.
3. Purged pump thoroughly to remove air bubbles.
4. Flushed column with strong solvent (e.g., 100% organic) to remove particulate blockage.
5. Cleaned / replaced guard column or inline filter if excessive debris was found.
6. Verified flow rate accuracy using a volumetric flask test.
7. Re-equilibrated column and re-injected system suitability standards.
8. Ensured no further pressure fluctuations before re-running batch.
✅ 5) Preventive Actions (PA)
Regular cleaning of inline filters.
Scheduled column maintenance (backflushing if allowed).
Strict filtration of mobile phase & samples through 0.22 µm filters.
Routine pump maintenance (seal wash, piston seal inspection).
Daily leak check before starting
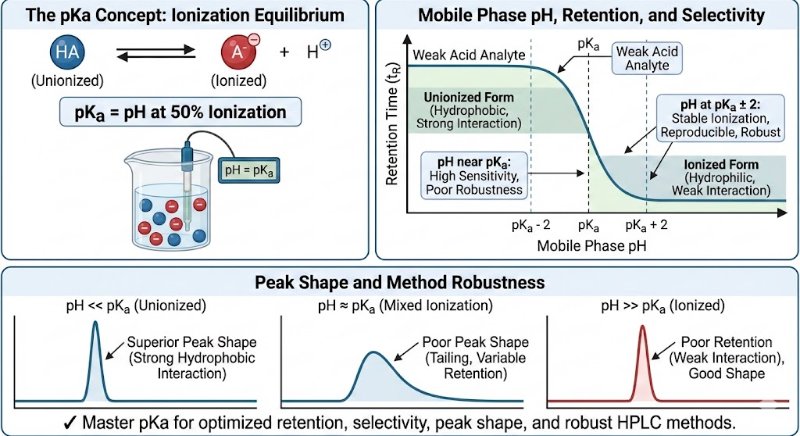
In analytical method development, particularly for analyzing active pharmaceutical ingredients (APIs) and their impurities, the pKa value of a compound is a fundamental parameter.
Why is pKa so vital?
The pKa value is the specific pH at which a molecule exists in a state of equal equilibrium between its ionized and unionized forms (50% ionized, 50% unionized). This balance is crucial because the ionization state directly dictates how a compound interacts with the HPLC system, influencing its retention time, selectivity, and overall peak shape.
Key Applications of pKa in Optimizing HPLC Methods
Strategic Mobile Phase pH Selection:
Choosing a mobile phase pH relative to the analyte's pKa is essential for controlling its ionization state and, consequently, its retention and resolution.
General Guideline: For stable ionization and reproducible chromatography, it is recommended to work at a pH that is at least 2 units away from the pKa value (pKa ± 2).
Achieving Superior Peak Shape:
The unionized form of a compound is typically more hydrophobic, allowing for stronger interactions with the stationary phase. This results in sharper, more symmetrical peaks.
Conversely, the ionized form is more hydrophilic and often shows poor retention, leading to undesirable broad, weak, or tailing peaks.
Improving Selectivity Between Analytes:
Compounds with different pKa values can be effectively separated by fine-tuning the mobile phase pH.
Even small adjustments in pH can significantly enhance resolution and selectivity, facilitating the separation of closely eluting peaks.
Ensuring Method Robustness:
A method operating at a mobile phase pH close to an analyte's pKa is highly sensitive to minor pH fluctuations. This can lead to inconsistent retention times and affect system suitability.
Working at a pH away from the pKa makes the method more robust and less susceptible to these small variations.
✔ In Summary: The pKa is more than just a number; it is a powerful guiding tool. By making pKa-driven decisions, analytical scientists can optimize retention, improve selectivity, prevent peak tailing, and ensure the robustness of their HPLC methods, ultimately leading to faster development and more reliable results.
No answers yet.
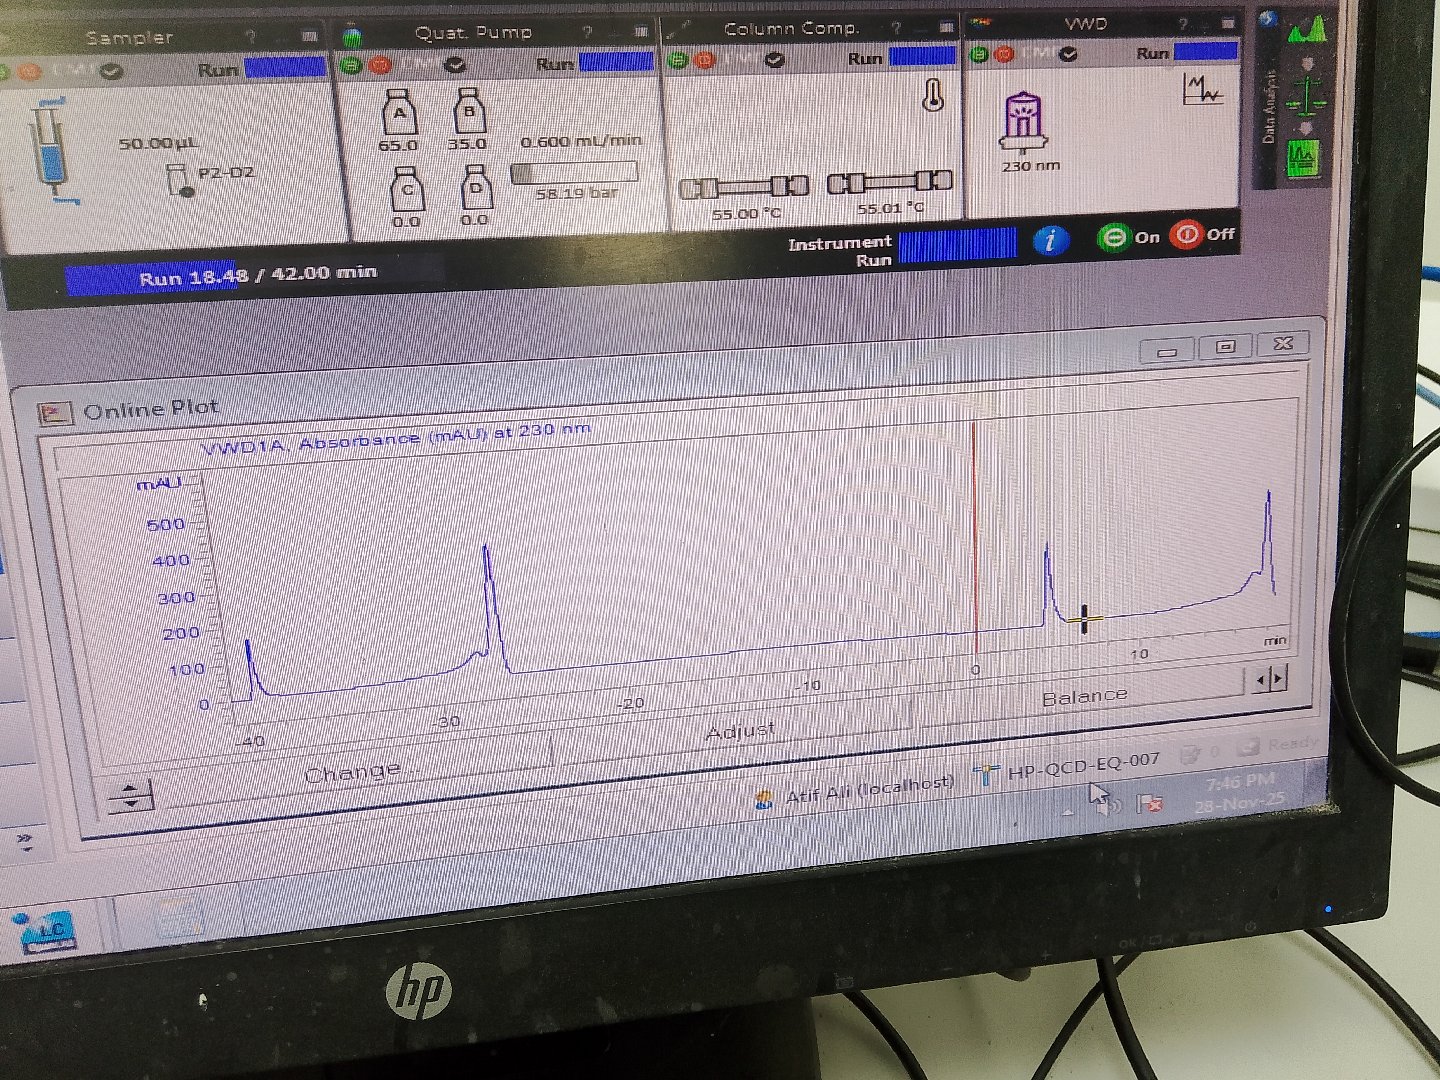
Please inform me of UV calibration with total perameter and it's procese
Muhammad Syahrul
11 m ago
In general, several parameters in UV-Vis and HPLC calibration include:Wavelength accuracy, Wavelength linearity, Noise & drift
Mobile App
Get the app for mobile access


