Download the HPLC Calculator App: The Ultimate HPLC Analysis Tool
Your expert companion for HPLC method development, liquid chromatography troubleshooting, and calculating parameters for both RP-HPLC and UPLC systems.
Get instant access to advanced HPLC calculations and community support
Questions


Serial dilution is a fundamental laboratory technique used to reduce concentration step by step. It ensures accurate analysis of pharmaceutical compounds, supports method validation, and provides consistency across regulatory standards.
What is Serial Dilution?
Serial dilution involves repeatedly diluting a solution by a fixed factor (commonly 1:10 or 1:100) using a solvent. This creates a series of decreasing concentrations and is widely applied in:
Analytical method validation
Microbiological assays
Pharmaceutical quality control
Why is it Essential?
Precision: Enables preparation of reliable low-concentration standards for calibration and testing.
Consistency: Provides uniform preparation to support inter-laboratory reproducibility and compliance with regulatory requirements.
Versatility: Useful for preparing standards, quantifying active ingredients, and studying dose-response relationships.
Step-by-Step Guide
Prepare a stock solution by accurately weighing or measuring the compound and dissolving it in a suitable solvent.
Dilute sequentially by transferring a fixed volume of the stock into successive containers with solvent, mixing thoroughly at each step.
Document concentrations carefully to ensure traceability and accuracy.
Serial dilution is not just a routine laboratory practice—it is a strategic process that underpins precision, reliability, and the success of pharmaceutical research and regulatory compliance.
#PharmaceuticalScience #MethodValidation #SerialDilution #LabTechniques #RegulatoryAffairs #DrugDevelopment #LinkedInLearning #Labtip #analytical #HPLC #RP_HPLC #FTIR #Pharmaceutical_sciences #drugs
No answers yet.
FTIR (Fourier Transform Infrared Spectroscopy) is a fundamental technique in analytical chemistry, materials science, and nanotechnology, providing a rapid, non-destructive way to:
Identify functional groups
Confirm chemical bonds
Validate structural changes in synthesized or extracted compounds
But how do we interpret FTIR spectra meaningfully?
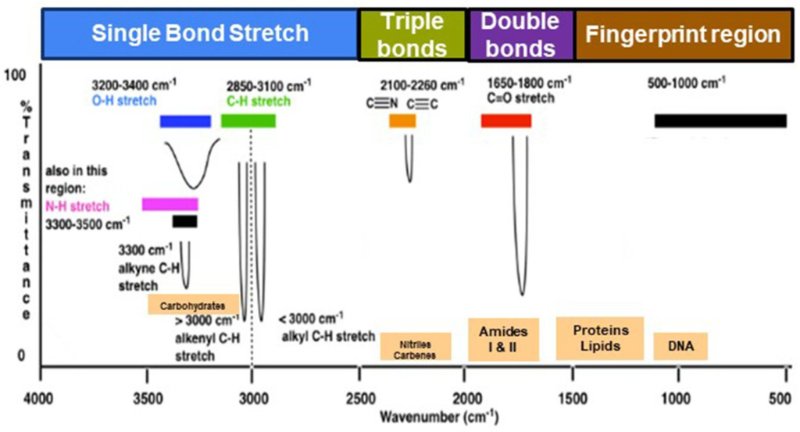
1. Understanding the Axes
X-axis (Wavenumber in cm⁻¹):
Runs right to left, from 4000 to 400 cm⁻¹.
Higher values = high-energy vibrations (O–H, N–H)
Lower values = complex vibrations (fingerprint region)
Y-axis (% Transmittance or Absorbance):
Indicates how much IR radiation is absorbed.
Stronger peaks = more absorption = stronger molecular vibration.
2. Divide the Spectrum into Regions
Region A: 4000–2500 cm⁻¹ (High-Energy Bonds)
• O–H (alcohols, phenols): ~3200–3600 cm⁻¹ → broad, strong
• N–H (amines): ~3300–3500 cm⁻¹ → sharp
• C–H (alkanes): ~2850–2960 cm⁻¹ → multiple sharp peaks
Region B: 2500–2000 cm⁻¹ (Triple Bonds)
• C≡C (alkynes): ~2100–2260 cm⁻¹ → weak
• C≡N (nitriles): ~2200–2260 cm⁻¹ → moderate
Region C: 2000–1500 cm⁻¹ (Double Bonds)
• C=O (carbonyl): ~1700–1750 cm⁻¹ → very strong
• C=C (aromatics): ~1600–1680 cm⁻¹ → moderate
• N–H bending: ~1550 cm⁻¹
Region D: 1500–600 cm⁻¹ — The Fingerprint Region
This region is unique for every compound and essential for confirmation.
Includes:
• C–O (alcohols, esters, ethers)
• S=O (sulfated polysaccharides): ~1220–1260 cm⁻¹
• C–N and C–Cl stretches
3. Pro Tips for Interpreting FTIR
Start with key functional groups: O–H, C=O, S=O
Analyze baseline and correct for water or CO₂ noise
Compare your results with reference spectra
For plant extracts or polysaccharides like fucoidan, focus on:
Broad O–H peaks
Aliphatic C–H groups
Sulfate (S=O) stretches
C–O–C glycosidic linkages
:)
No answers yet.
Mobile App
Get the app for mobile access