Download the HPLC Calculator App: The Ultimate HPLC Analysis Tool
Your expert companion for HPLC method development, liquid chromatography troubleshooting, and calculating parameters for both RP-HPLC and UPLC systems.
Get instant access to advanced HPLC calculations and community support
Questions
Hello everyone im conducting HAA9 analysis in water samples with SPE in LC MS/MS and im observing reduced areas of the peaks over the months. The LC works normally for other methods. Can someone has the same problem in HAA analysis? Or doing the same analysis? The LCMS is the Shimadzu 8050. Thank you!
No answers yet.


1. Principle
LC-MS (Liquid Chromatography–Mass Spectrometry):
Separates analytes in the liquid phase using HPLC and detects them with a mass spectrometer.
Suitable for non-volatile, thermally labile, polar, and high-molecular-weight compounds.
GC-MS (Gas Chromatography–Mass Spectrometry):
Separates analytes in the gaseous phase using gas chromatography, followed by mass spectrometric detection.
Best suited for volatile, thermally stable, and low-molecular-weight compounds.
2. Sample Requirements
LC-MS: No need for volatility; minimal derivatization required.
GC-MS: Requires analytes to be volatile, or chemically derivatized to achieve volatility.
3. Ionization Techniques
LC-MS: Soft ionization methods such as ESI (Electrospray Ionization) and APCI (Atmospheric Pressure Chemical Ionization); ideal for large biomolecules.
GC-MS: Hard ionization methods like EI (Electron Ionization) or CI (Chemical Ionization); produce extensive fragmentation, aiding structural elucidation.
4. Destructive Nature
Both LC-MS and GC-MS are destructive techniques since analytes are ionized and fragmented. The difference lies in the type of data generated, sensitivity, and applicability.
Applications in Pharmaceuticals
LC-MS:
Impurity profiling (including genotoxic impurities – GTIs)
Bioanalytical studies (PK/PD, metabolism)
Peptide/protein characterization
Residual solvents & polar, non-volatile impurities
Stability studies of non-volatile degradants
GC-MS:
Residual solvent analysis (ICH Q3C compliance)
Detection of volatile organic impurities
Extractables & leachables assessment
Identification of volatile degradation products
Profiling of volatile intermediates
Regulatory Perspective
Regulatory agencies (FDA, EMA, ICH):
Recommend LC-MS/MS for genotoxic impurities, nitrosamines, and metabolites.
Recognize GC-MS as the standard for residual solvents (ICH Q3C).
In practice: Residual Solvents → GC-MS | Genotoxic Impurities → LC-MS
Summary
LC-MS and GC-MS are complementary, not interchangeable. The choice depends on analyte properties, sensitivity requirements, and regulatory guidance. The pharmaceutical industry applies both techniques in parallel rather than relying on just one.
No answers yet.

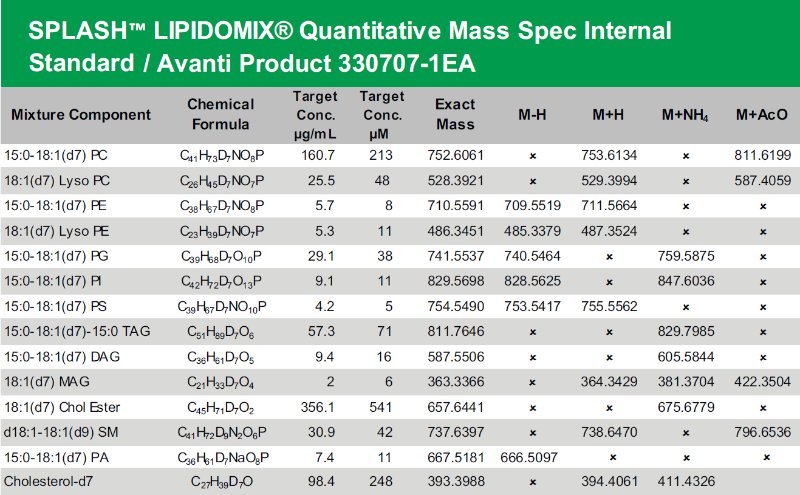
Does anyone try to run SPLASH Lipidomix Quantitative Mass Spec Internal standard by HILIC method on Agilent LC-QTOF? I do not see peaks on the chromatogram, neither positive nor negative ionization mode, and I am wondering what is the source of the problem - smth wrong with detector settings, LC method issues, column issues (we use Luna 3µm), standard mixture issues etc.
Is this problem only with this standard ?
have you tried any old method to make sure that the problem is not with the instrument ?
In Linearity solutions area variation observed but standard area remains same.
what is your matrix ?
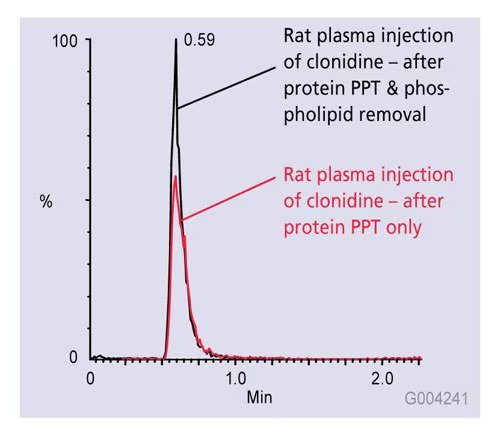
I was analyzing plasma samples using LC-MS/MS for a drug quantification study. The standard curve looked great in pure solvent, but when I injected extracted plasma samples, the signal dropped significantly.
After some digging, I realized the problem was ion suppression caused by co-eluting matrix components. These were interfering with ionization efficiency in the ESI source.
Switching to solid-phase extraction (SPE) instead of protein precipitation helped clean up the matrix, and the response came back to normal. Ever since, I always test for matrix effects early in method development.
No answers yet.
Mobile App
Get the app for mobile access