Download the HPLC Calculator App: The Ultimate HPLC Analysis Tool
Your expert companion for HPLC method development, liquid chromatography troubleshooting, and calculating parameters for both RP-HPLC and UPLC systems.
Get instant access to advanced HPLC calculations and community support
Questions

In HPLC analysis, the biggest lie a chromatogram can tell you is that "bigger peak = more amount."
We all know that different molecules interact with detectors differently. Yet, assuming a Relative Response Factor (RRF) of 1.0 for impurities is still a common shortcut that can lead to dangerous under- or over-estimation of toxic impurities.
Why RRF Determination is Non-Negotiable:
Chromophore Differences: Just because it’s an isomer doesn’t mean it absorbs UV light the same way.
Wavelength Sensitivity: An RRF valid at 254 nm might be completely wrong at 210 nm.
Regulatory Impact: ICH guidelines (Q3A/Q3B) often require correction factors if the response differs by more than 10-20% (0.8–1.2).
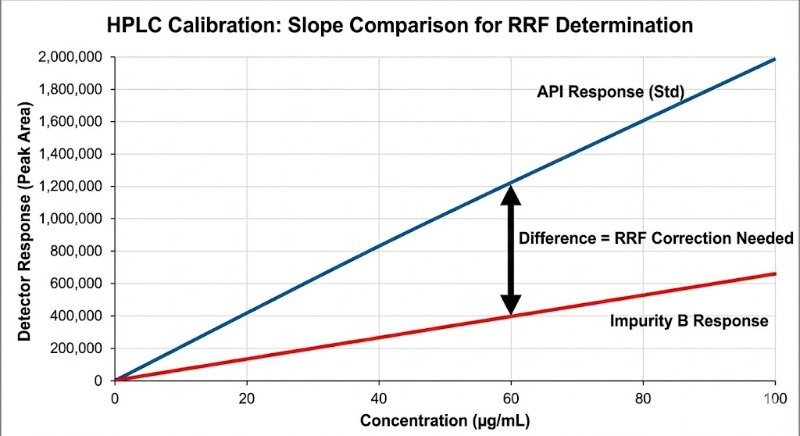
The "Slope Method" Gold Standard: To get a true RRF, avoid the single-point check. You need to compare the slopes of the linearity curves (Impurity vs. API) to rule out matrix effects and intercept bias.
RRF = Slope (Impurity) / Slope (API)
If you aren't correcting for response factors, are you really quantifying? Or are you just guessing?
How does your lab handle RRFs for unknown impurities? Do you default to 1.0 or run full slope-method determinations?
No answers yet.

In analytical science, precision is non-negotiable. Yet, one silent contaminant can distort results and jeopardize data integrity — carryover.
What is Carryover?
Carryover is the unintentional transfer of analyte from one sample injection to the next. Even trace residues can cause:
False positives
Inflated concentrations
Poor reproducibility
Regulatory non-compliance
Where Does It Come From?
Autosampler needle – inadequate washing
Syringe/injection port – especially in GC
Tubing and valves – adsorptive surfaces
Column or detector flow cell – strong retention
MS ion source – memory effects in LC-MS/MS
How to Detect It
Inject blanks after high-concentration samples
Watch for baseline drift or ghost peaks
Apply bracketing standards during validation
How to Prevent It
Use strong wash solvents with multiple rinses
Run a blank between critical samples
Select low-adsorption components (e.g., PTFE tubing)
Optimize autosampler wash/dwell times
Use column backflush or switching valves in GC
Apply divert valves or clean the source in LC-MS
Regulatory Perspective
Carryover evaluation is a required step in method validation as per ICH Q2(R1) and FDA/EMA guidelines.
Key Takeaway
Carryover may be subtle, but its consequences are serious. Prevent it with proper cleaning, smart method design, and strict validation practices.
#HPLC #GC #LCMS #AnalyticalChemistry #Carryover #MethodValidation #QAQC #Pharma #Biotech #Chromatography #RegulatoryCompliance #HPLCtraining #SkillDevelopment
No answers yet.

During HPLC method validation for related substances, spiking impurities at levels below the LOQ may seem unnecessary—since values below LOQ are “not quantifiable.” However, this practice is critical for proving the sensitivity, robustness, and reliability of the method.
Purpose of Spiking Below LOQ
Detection Capability (LOD Check): Confirms impurities can still be distinguished from baseline noise at trace levels.
Specificity Verification: Ensures no interference from the API or excipients.
Regulatory Compliance: Meets ICH Q2(R1) requirements for sensitivity and selectivity.
Consistency Near Threshold: Assesses precision (%RSD) around detection limits, confirming method reliability.
Example
LOQ = 0.05%
Spike at 0.03% (below LOQ) → A reproducible peak should appear, demonstrating real detection capability.
Accuracy Studies – Spiking Levels
If the specification limit = 0.1%:
50% level → 0.05%
100% level → 0.10%
150% level → 0.15%
Adding a spike below LOQ (e.g., 0.03%) reinforces evidence of sensitivity.
Spiking Matrices
Placebo: Essential for assessing matrix interference.
API Solution: Supports selectivity data.
Finished Product: Best representation of real conditions.
Precision at Trace Levels
Although values below LOQ aren’t quantifiable, replicate injections (e.g., n=6) with and without spiking enable %RSD evaluation, confirming absence of random noise at trace levels.
⸻
Conclusion
Spiking below LOQ is not about quantifying impurities—it’s about demonstrating the method’s ability to consistently detect, discriminate, and remain stable at the lowest relevant levels. This builds scientific confidence and strengthens data integrity beyond regulatory compliance.
#PharmaceuticalAnalysis #HPLC #MethodValidation #ICHGuidelines #QualityAssurance #DrugImpurities
No answers yet.

Method validation is fundamental for ensuring the accuracy, reliability, and regulatory compliance of analytical data in pharmaceuticals, #QualityControl, R&D, and natural product analysis.
1. #Specificity
How to Perform: Inject blank, placebo, standard, and sample solutions.
What to Evaluate: Confirm there's no interference at the analyte’s retention time.
Applicable Instruments: HPLC, LC-MS, GC, etc.
2. #Linearity
How to Perform: Prepare at least five concentrations (e.g., 80%, 90%, 100%, 110%, 120%).
What to Evaluate: Plot concentration vs. peak area, and calculate the correlation coefficient (R² ≥ 0.995).
Applicable Instruments: HPLC, UV, etc.
3. #Accuracy / #Recovery
How to Perform: Spike known amounts of standard into the sample at three levels (e.g., 80%, 100%, 120%).
What to Evaluate: %Recovery = (Detected / Added) × 100
Acceptance Range: 98–102% for APIs
Replicates: Three per level
4. #Precision
Repeatability (Intra-day): Analyze six replicates of the same concentration on the same day.
Intermediate Precision (Inter-day): Repeat on different days, using different analysts or instruments.
What to Evaluate: %RSD should be ≤ 2%
5. Limit of Detection (LOD)
How to Perform: Use the formula LOD = 3.3 × (σ/S), where σ = standard deviation of the response, and S = slope.
Alternative Approach: Use a signal-to-noise ratio of 3:1.
✔️ 6. #LimitOfQuantitation / #LOQ
How to Perform: LOQ = 10 × (σ/S)
Alternative Approach: Signal-to-noise ratio of 10:1
More stringent than LOD
7. #Range
How to Determine: Based on results from linearity, accuracy, and precision studies.
What to Evaluate: Must cover 80–120% of the target analyte concentration.
⚙️ 8. #Robustness
How to Perform: Slightly vary method parameters:
• Mobile phase pH ± 0.2
• Flow rate ± 0.1 mL/min
• Column temperature ± 2°C
What to Evaluate: Ensure %RSD and retention time remain within acceptable limits.
9. #Ruggedness
How to Perform: Conduct analysis under varying conditions:
• Different analysts
• Different instruments
• Different laboratories
What to Evaluate: Results should remain consistent (%RSD ≤ 2%)
✅ 10. System Suitability
How to Perform: Inject system suitability solution before and during the analysis.
Key Parameters:
• %RSD (area or RT) ≤ 2%
• Theoretical plates (N) ≥ 2000
• Tailing factor ≤ 2
• Resolution ≥ 2 between critical peaks
These validation parameters are the foundation of reliable results in #HPLC, LC-MS, and other analytical techniques.
Are all these checkpoints part of your method validation workflow?
#QualityControl #MethodValidation #AnalyticalScience #ICHQ2 #PharmaTesting #MethodVerification #RegulatoryCompliance
No answers yet.
Mobile App
Get the app for mobile access