Download the HPLC Calculator App: The Ultimate HPLC Analysis Tool

Your expert companion for HPLC method development, liquid chromatography troubleshooting, and calculating parameters for both RP-HPLC and UPLC systems.

Get instant access to advanced HPLC calculations and community support

113
Questions Asked
72
Answers Given
518
Community Members
0
Questions Today
Questions
Question image

In HPLC analysis, the biggest lie a chromatogram can tell you is that "bigger peak = more amount."

We all know that different molecules interact with detectors differently. Yet, assuming a Relative Response Factor (RRF) of 1.0 for impurities is still a common shortcut that can lead to dangerous under- or over-estimation of toxic impurities.

Why RRF Determination is Non-Negotiable:

Chromophore Differences: Just because it’s an isomer doesn’t mean it absorbs UV light the same way.

Wavelength Sensitivity: An RRF valid at 254 nm might be completely wrong at 210 nm.

Regulatory Impact: ICH guidelines (Q3A/Q3B) often require correction factors if the response differs by more than 10-20% (0.8–1.2).

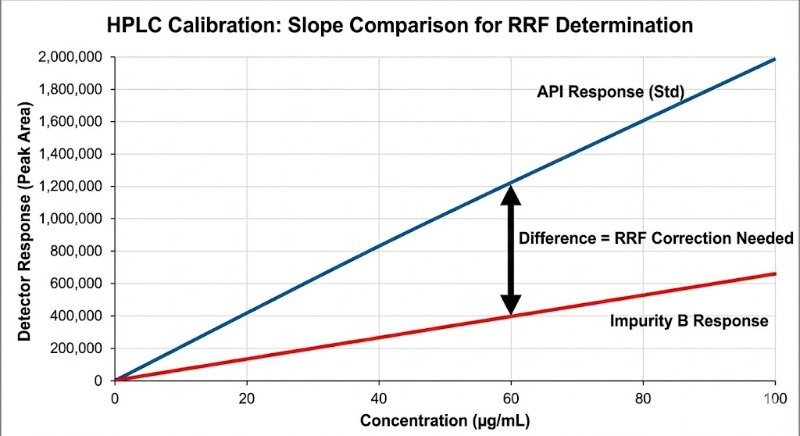
The "Slope Method" Gold Standard: To get a true RRF, avoid the single-point check. You need to compare the slopes of the linearity curves (Impurity vs. API) to rule out matrix effects and intercept bias.

RRF = Slope (Impurity) / Slope (API)

If you aren't correcting for response factors, are you really quantifying? Or are you just guessing?

How does your lab handle RRFs for unknown impurities? Do you default to 1.0 or run full slope-method determinations?

340 views

No answers yet.

Frequently Asked Questions: HPLC Analysis & Chromatography

High-Performance Liquid Chromatography (HPLC) is an analytical technique used to separate, identify, and quantify each component in a mixture. It relies on a pump to pass a pressurized liquid solvent containing the sample mixture through a column filled with a solid adsorbent material. Each component in the sample interacts slightly differently with the adsorbent material, causing different flow rates for the different components and leading to the separation of the components as they flow out of the column.

Column efficiency is typically measured by the number of Theoretical Plates ($N$). The most common formula is $N = 16 \times (t_r / W)^2$, where $t_r$ is the retention time and $W$ is the peak width at the base. A higher number of theoretical plates indicates a sharper peak and better analytical separation. You can calculate this instantly using our Theoretical Plates Calculator.

The ICH (International Council for Harmonisation) Q2(R1) guidelines mandate specific validation parameters for HPLC methods. These include assessing Accuracy, Precision (Repeatability and Intermediate Precision), Specificity, Detection Limit (LOD), Quantitation Limit (LOQ), Linearity, and Range. Our calculators are designed specifically to help analysts easily compute these linearity, LOD/LOQ, and %RSD parameters in compliance with ICH standards.
Popular Search Trends & Keywords
HPLC Calculator Agilent HPLC metrics HPLC detector (DAD/UV) HPLC MS analysis HPLC pump pressure RP-HPLC parameters Chromatography principles UPLC method scaling Hb HPLC method Liquid chromatography tools