How to Read and Interpret FTIR Spectra — A Complete Guide??
FTIR (Fourier Transform Infrared Spectroscopy) is a fundamental technique in analytical chemistry, materials science, and nanotechnology, providing a rapid, non-destructive way to:
Identify functional groups
Confirm chemical bonds
Validate structural changes in synthesized or extracted compounds
But how do we interpret FTIR spectra meaningfully?
1. Understanding the Axes
X-axis (Wavenumber in cm⁻¹):
Runs right to left, from 4000 to 400 cm⁻¹.
Higher values = high-energy vibrations (O–H, N–H)
Lower values = complex vibrations (fingerprint region)
Y-axis (% Transmittance or Absorbance):
Indicates how much IR radiation is absorbed.
Stronger peaks = more absorption = stronger molecular vibration.
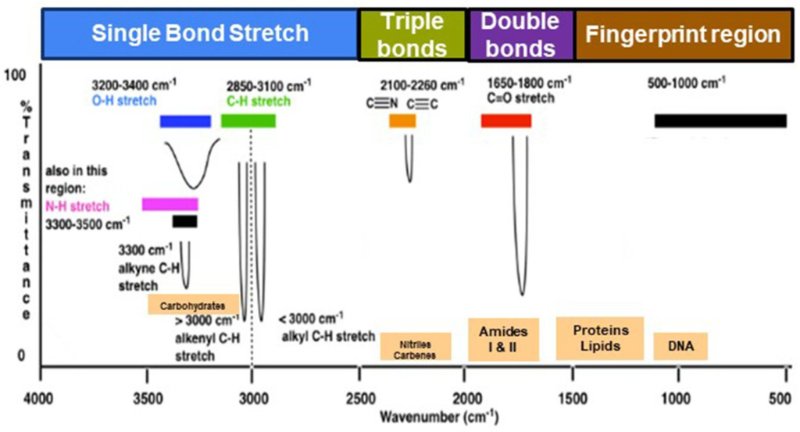
2. Divide the Spectrum into Regions
Region A: 4000–2500 cm⁻¹ (High-Energy Bonds)
• O–H (alcohols, phenols): ~3200–3600 cm⁻¹ → broad, strong
• N–H (amines): ~3300–3500 cm⁻¹ → sharp
• C–H (alkanes): ~2850–2960 cm⁻¹ → multiple sharp peaks
Region B: 2500–2000 cm⁻¹ (Triple Bonds)
• C≡C (alkynes): ~2100–2260 cm⁻¹ → weak
• C≡N (nitriles): ~2200–2260 cm⁻¹ → moderate
Region C: 2000–1500 cm⁻¹ (Double Bonds)
• C=O (carbonyl): ~1700–1750 cm⁻¹ → very strong
• C=C (aromatics): ~1600–1680 cm⁻¹ → moderate
• N–H bending: ~1550 cm⁻¹
Region D: 1500–600 cm⁻¹ — The Fingerprint Region
This region is unique for every compound and essential for confirmation.
Includes:
• C–O (alcohols, esters, ethers)
• S=O (sulfated polysaccharides): ~1220–1260 cm⁻¹
• C–N and C–Cl stretches
3. Pro Tips for Interpreting FTIR
Start with key functional groups: O–H, C=O, S=O
Analyze baseline and correct for water or CO₂ noise
Compare your results with reference spectra
For plant extracts or polysaccharides like fucoidan, focus on:
Broad O–H peaks
Aliphatic C–H groups
Sulfate (S=O) stretches
C–O–C glycosidic linkages
:)
